580 California St., Suite 400
San Francisco, CA, 94104

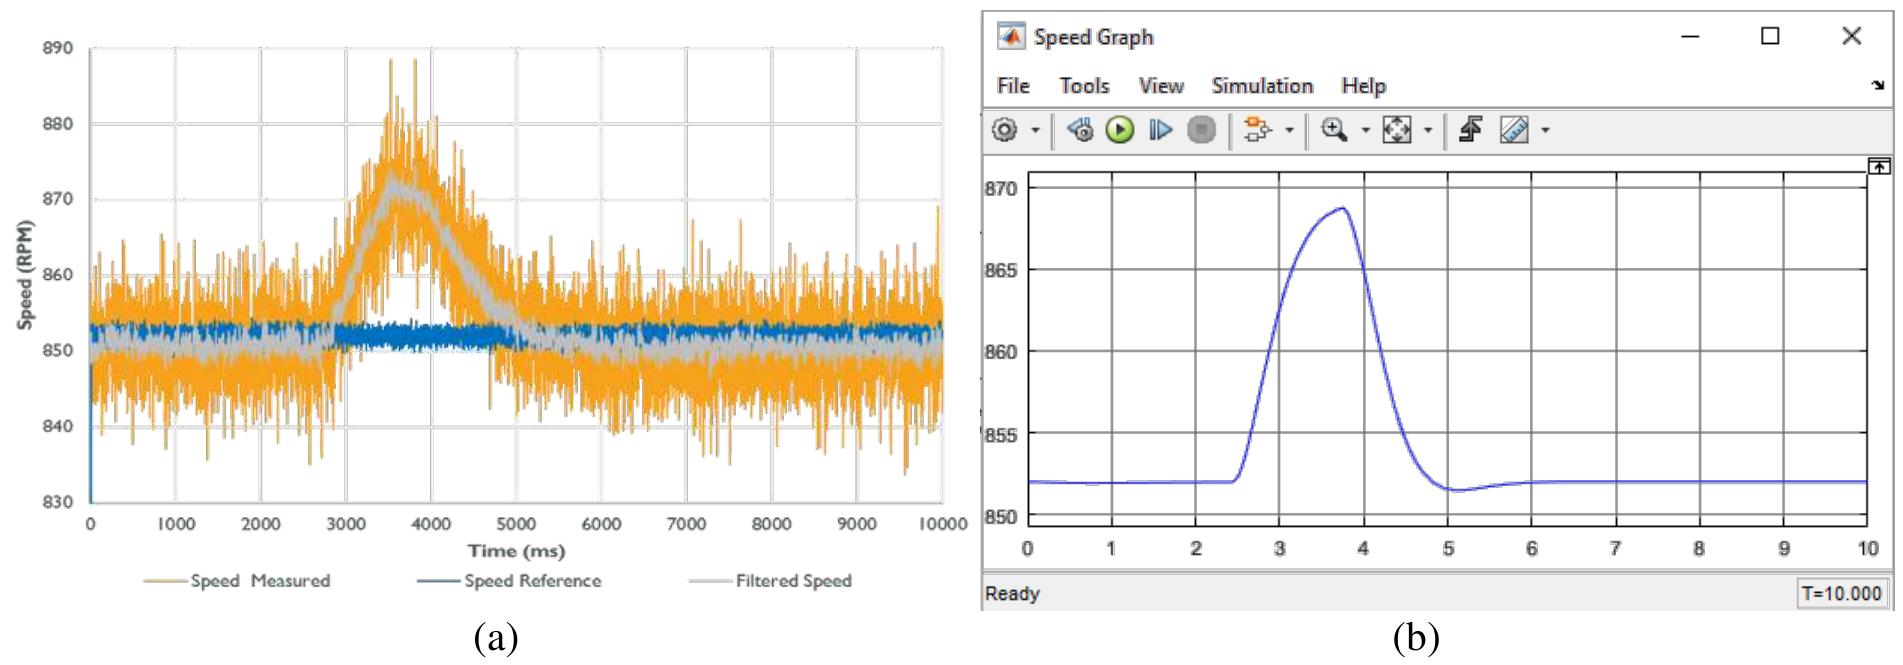
Figure 20 The model can visualize the conditions in which the engine accepts speed changes every 5 seconds. Simulink modeling uses 900 rpm and 800 rpm up and down repeatedly during the process. The result of graph speed at unstable speed condition can be seen on figure 20. On the other hand, the result of torque at unstable speed condition at 100 % and 110% power are shown on figure 21 (a) and figure 21 (b) respectively.