580 California St., Suite 400
San Francisco, CA, 94104

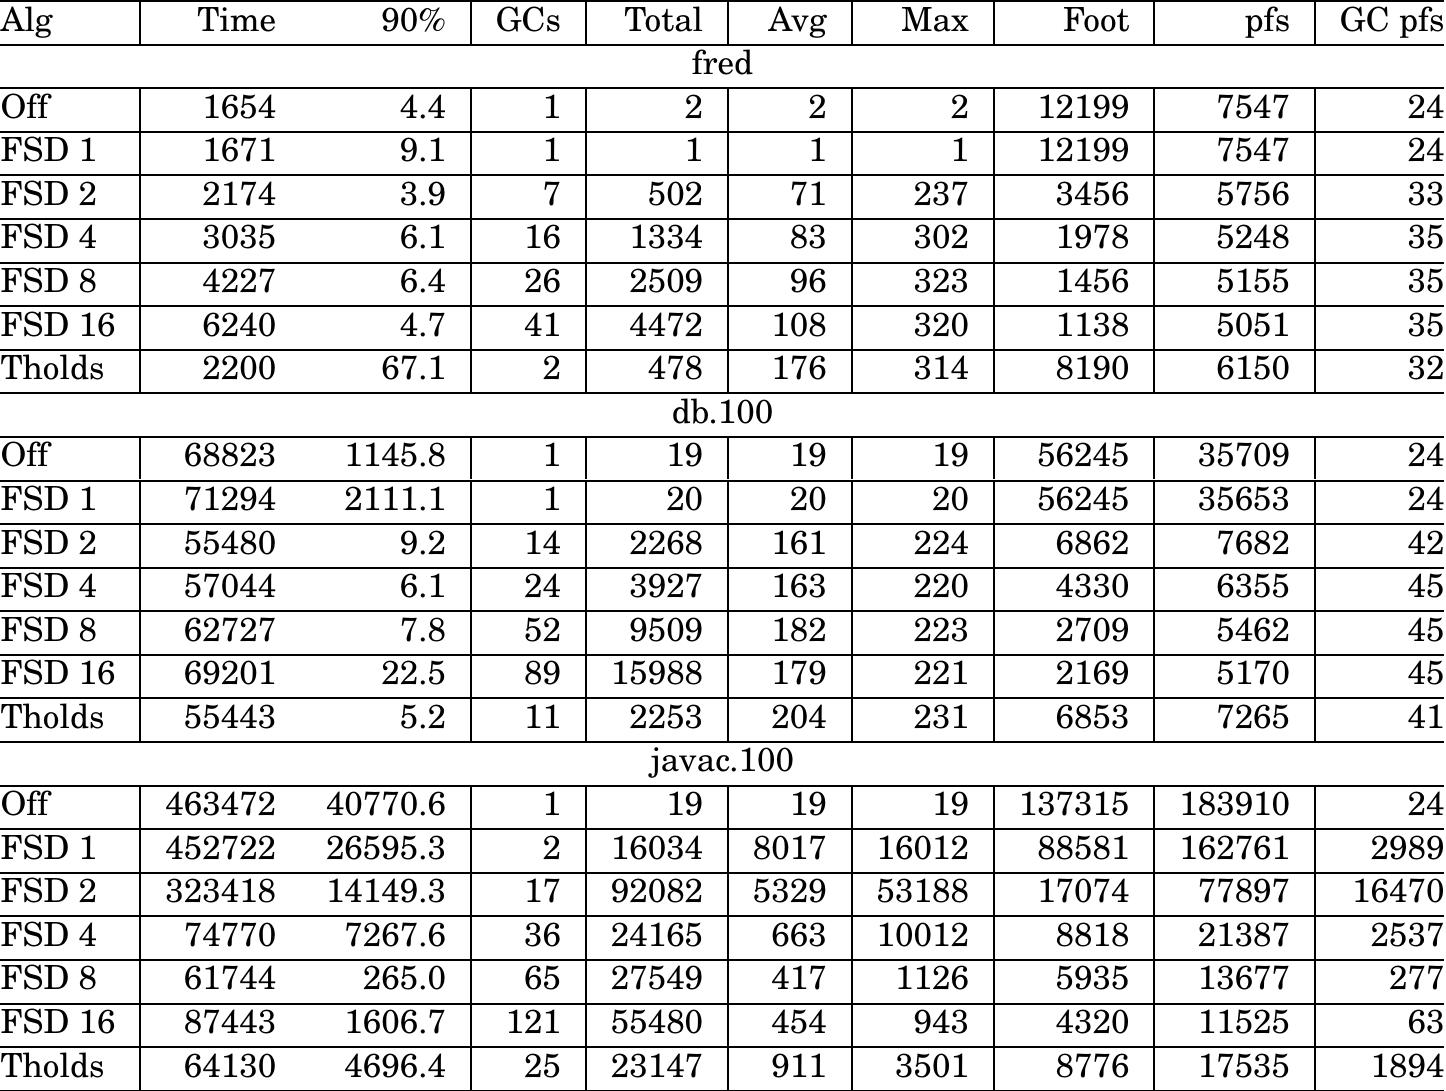
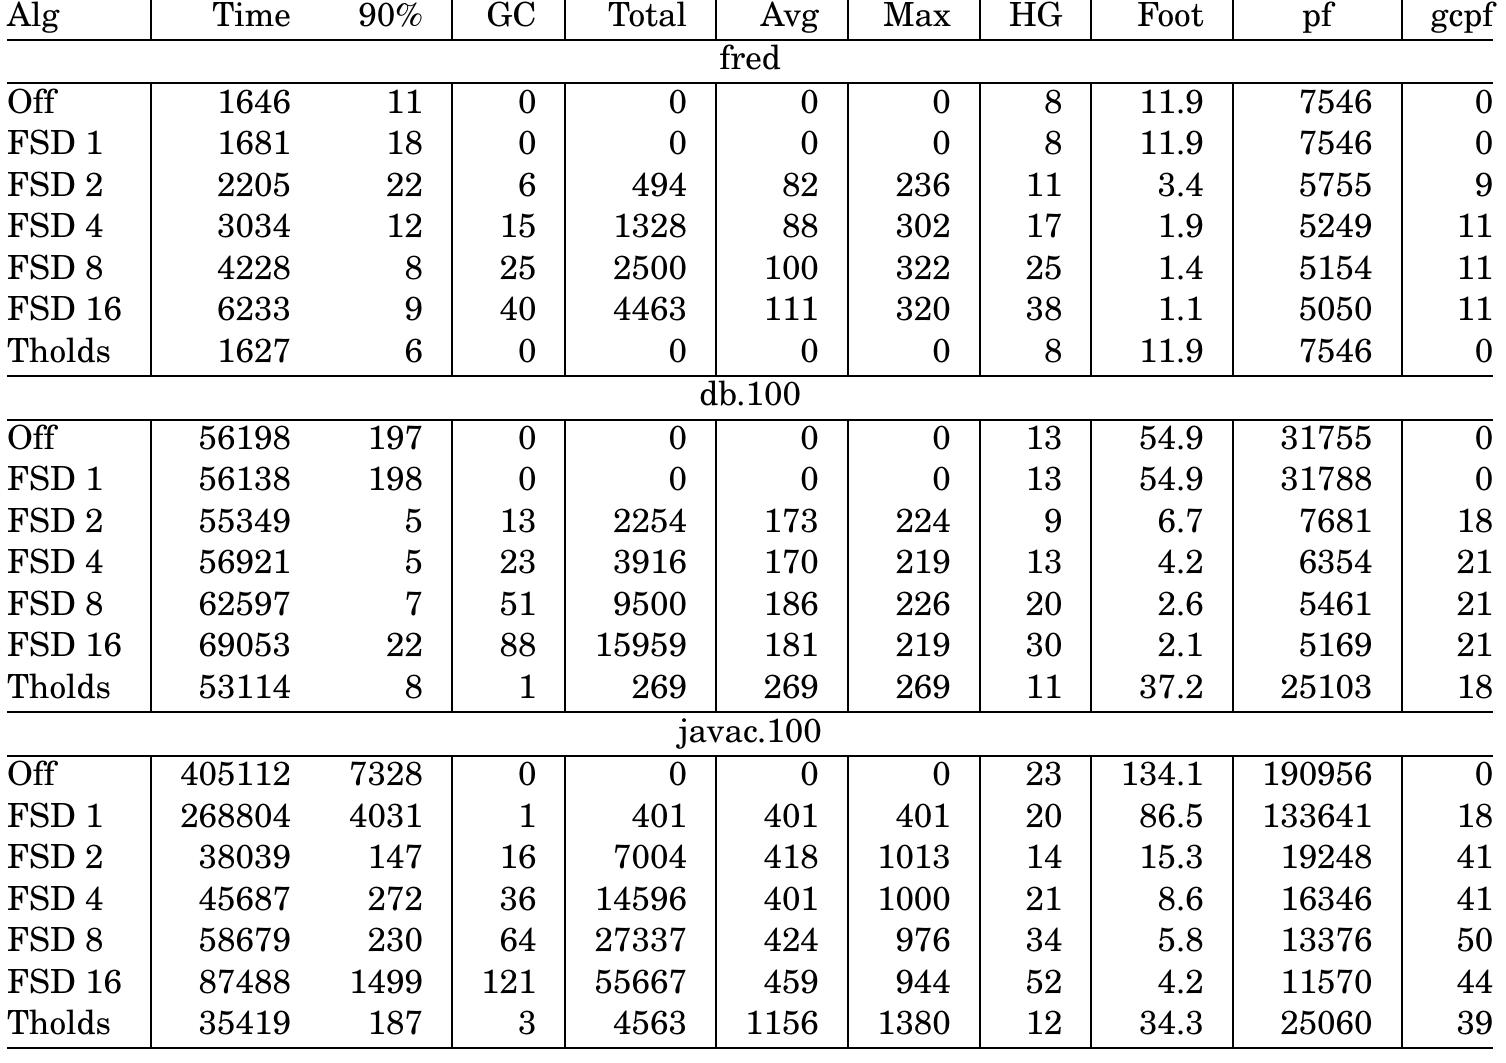
Figure 3 Comparing the threshold-based algorithm with the BDW algorithm using different FSD values on a 64 MB system. These graphs show the execution time of each application when run using the threshold-based algorithm, normalized with respect to the execution time obtained when run using the specified FSD value.