580 California St., Suite 400
San Francisco, CA, 94104

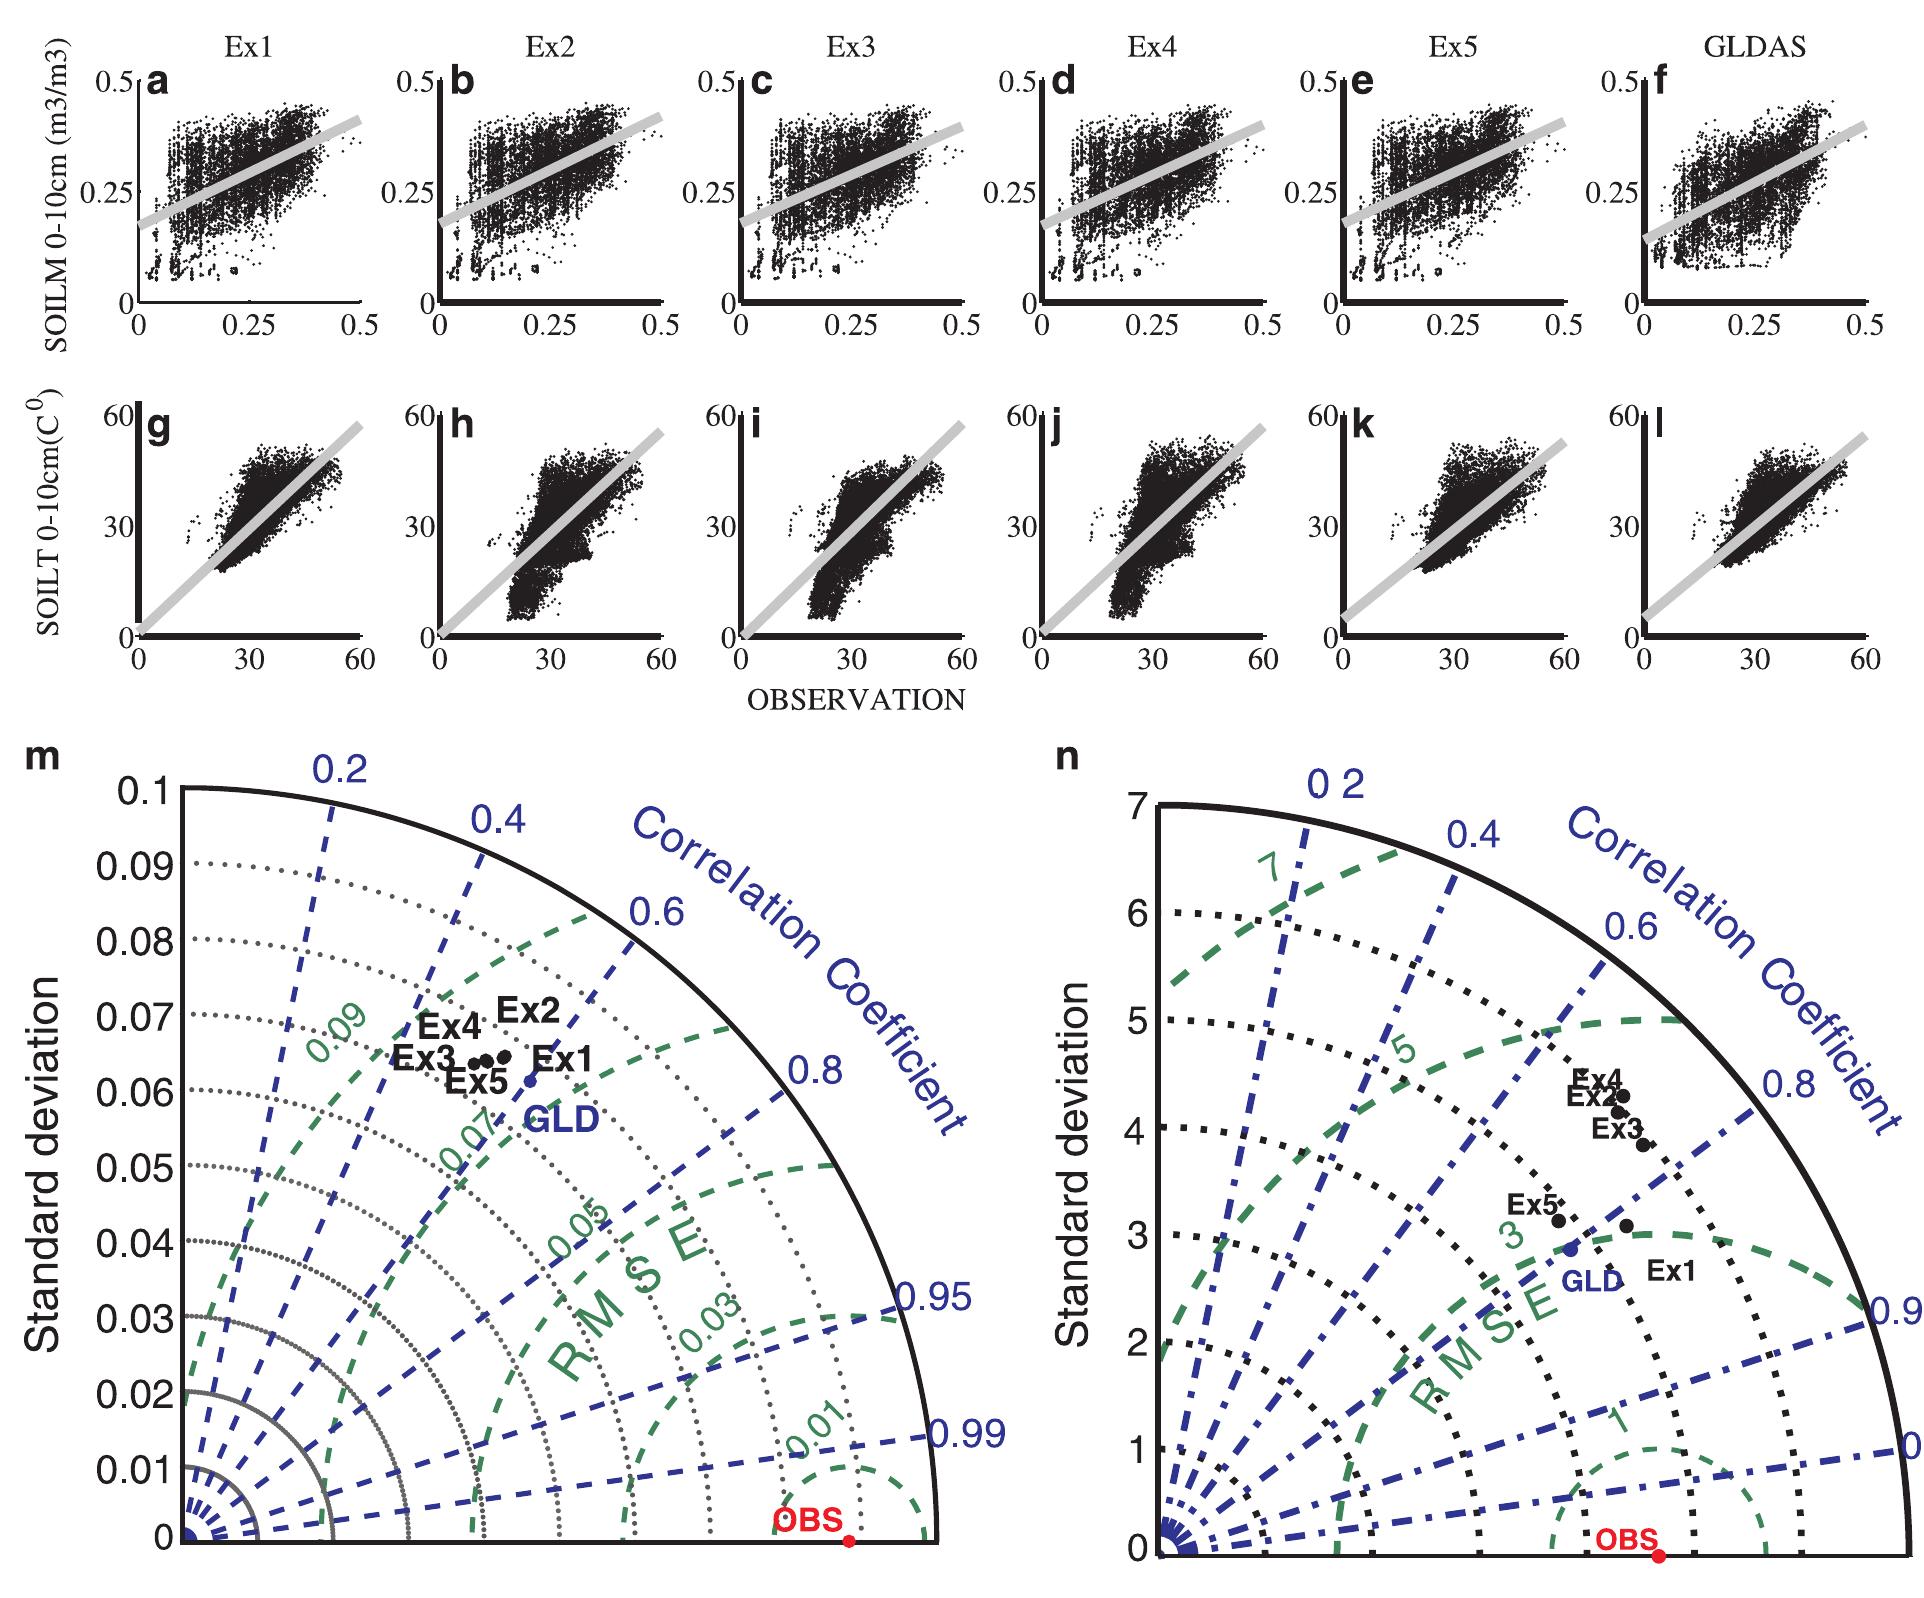
Figure 3 Comparison of error statistics of the surface forcing parameters from different reanalysis products at in-situ station observations (shown in Fig. 1) for the period 2011-2013. The first column represents number of stations per bin of (a) correlation (r), (b) root mean square error (RMSE), (c) mean bias (BIAS) and (d) the ratio of the standard deviation of the reanalysis product o to that from the observations 6455 (O;atio)s for temperature at 2m (°C). (e-h), (i-l) and (m-p) are same as (a-d), but for surface pressure (hPa), surface downward short wave (W m7 *), and long wave (W m ~”) radiation respectively. The figure is generated using MATLAB 2015a, www.mathworks.com. Figure 3. Comparison of error statistics of the surface forcing parameters from different reanalysis Table 3. Parameter values for linear regression fits (y = ax + b), correlation coefficient (r) and root mean square error (RMSE) for T2 (°C), PSFC (hPa), SWRAD (W m7”) and LWRAD (W m7”) obtained from each analysis/forecast products to in-situ observations.