580 California St., Suite 400
San Francisco, CA, 94104

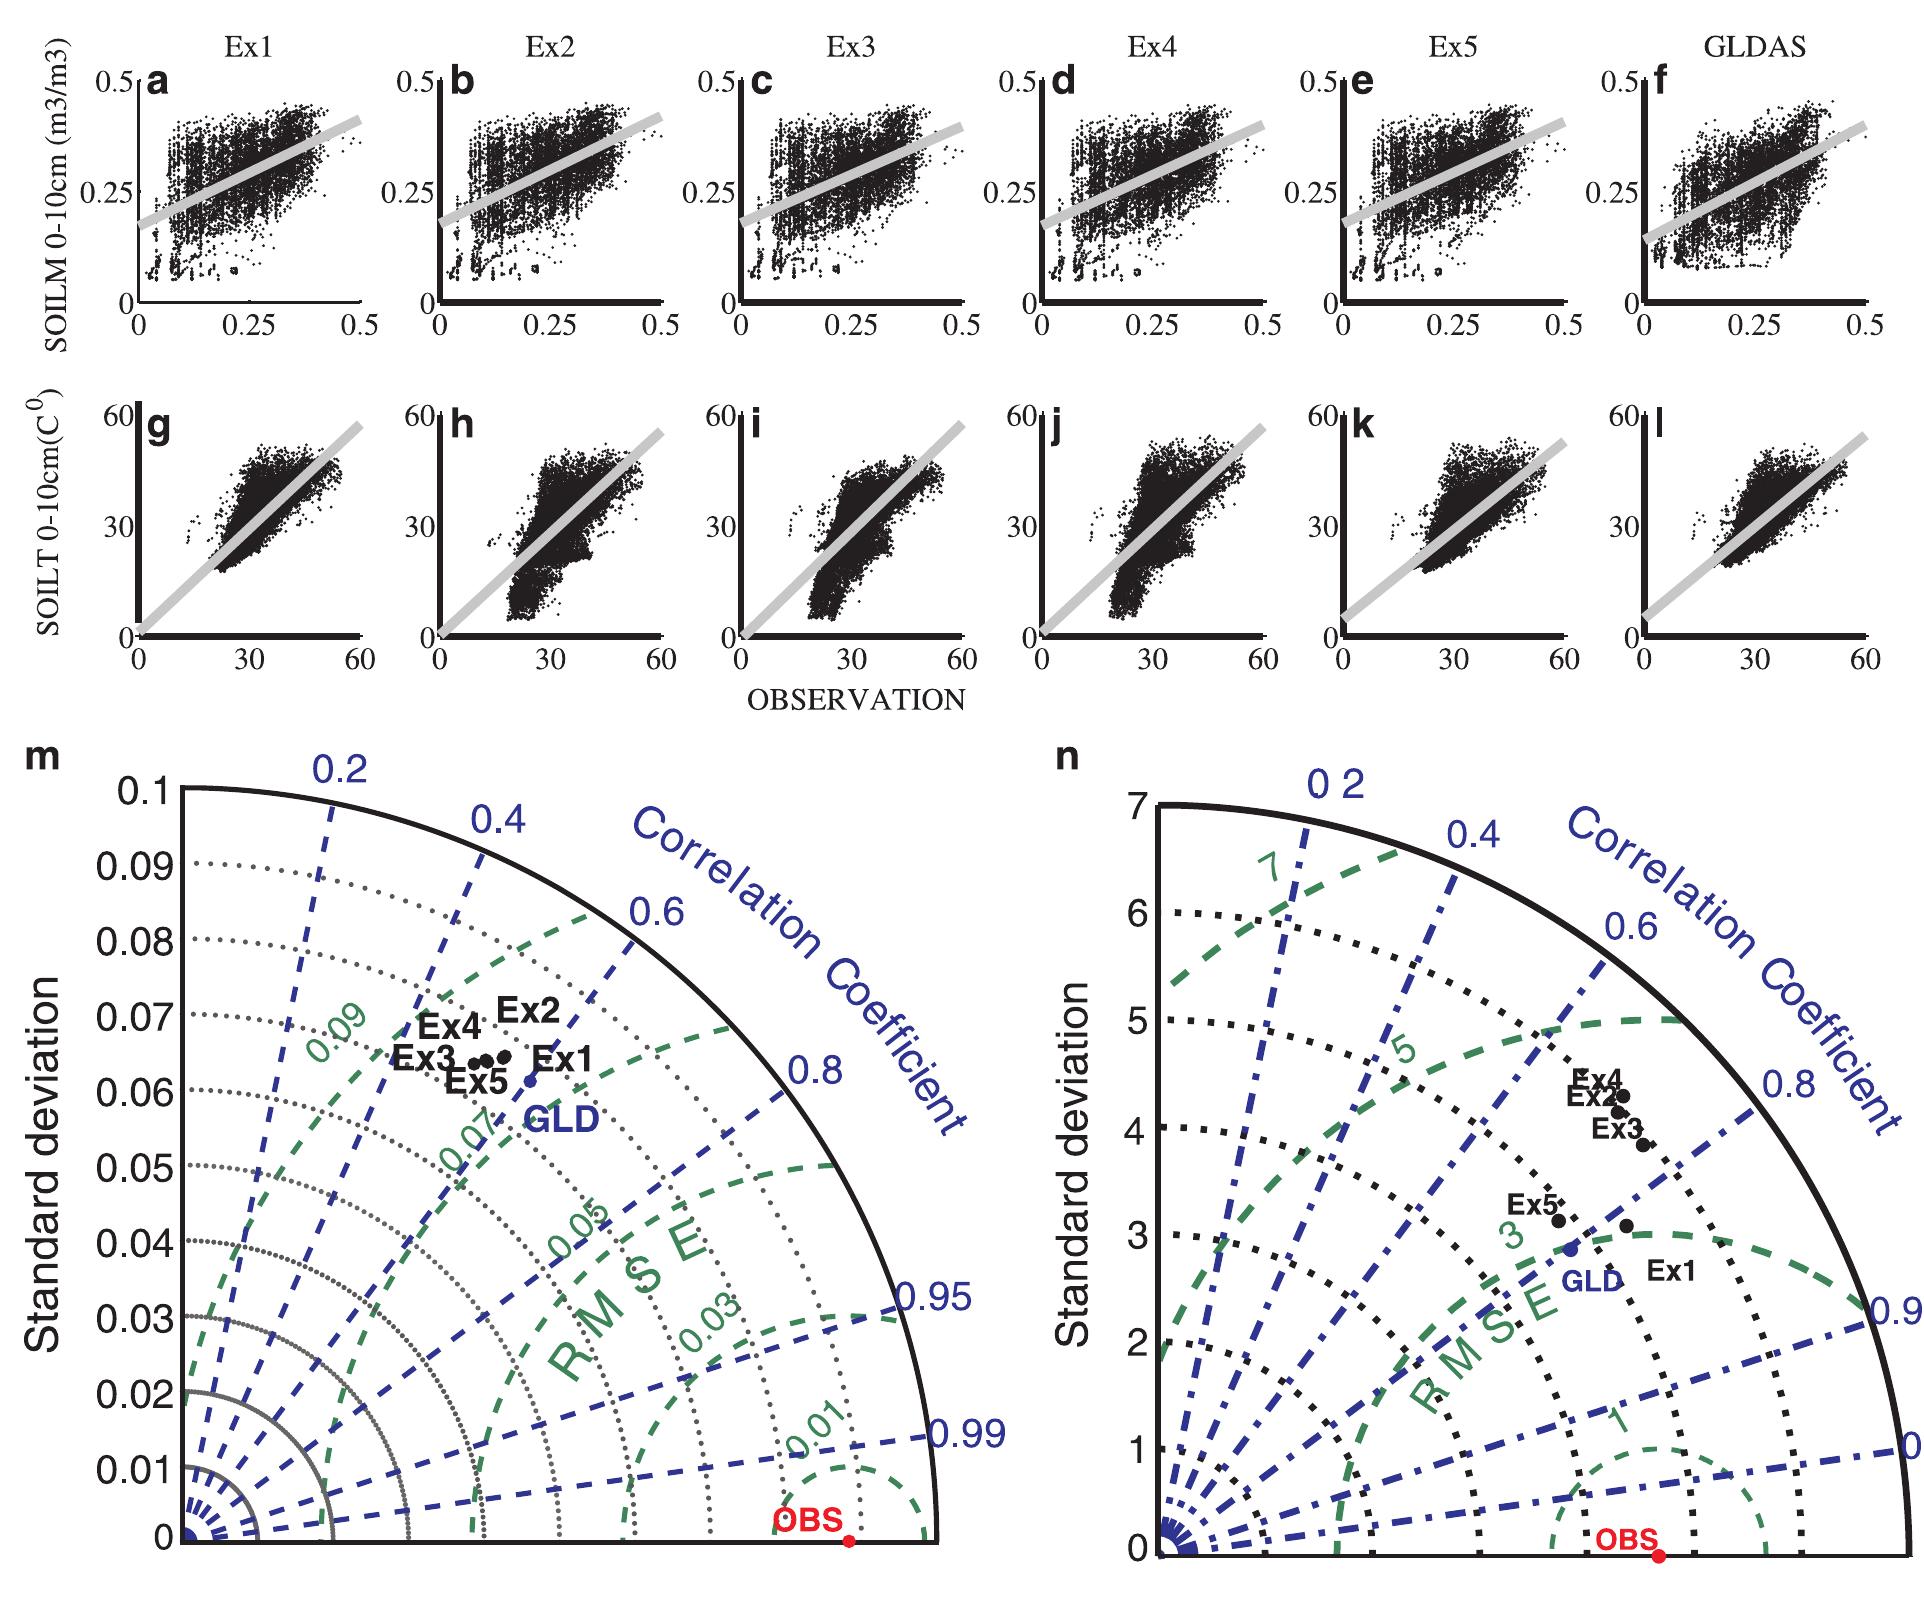
Figure 5 Relation between forcing error and LDAS output error. The top row presents scatter diagram of LDAS soil moisture (m* m~*) error with error in temperature at 2 m (°C) obtained from a) Ex1, b) Ex2, c) Ex3, d) Ex4, e) Ex5. (f-j) and (k-o) are same as (a-e), but for surface downward long wave (W m~’), and short wave (W m~’) radiation respectively. (p-ad) is same as (a—-o) but for LDAS soil temperature (°C). All the relationship is calculated at 95% confidence level. The figure is generated using MATLAB 2015a, www. mathworks.com.