580 California St., Suite 400
San Francisco, CA, 94104

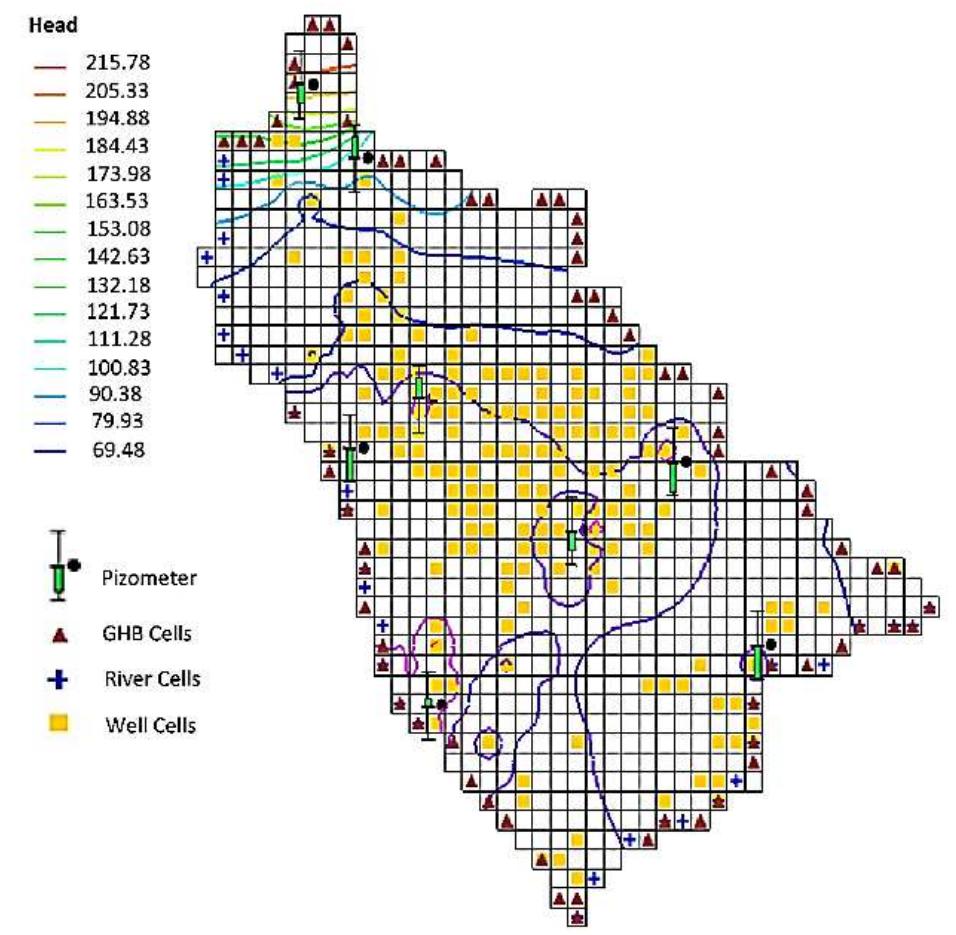
Figure 2 (a) unit hydrograph and precipitation through the research time frame, (b) Thiessen polygons and each piezometer weight, and (c) Temperature (C) and evaporation (mm) values during research time frame In this investigation, we employed models based on Al in addition to the numerical model developed by GMS in order to forecast changes in the level of groundwater in the plain. This was done to reduce the amount of time spent processing vast volumes of data and save time overall, in addition to taking into consideration the complexity of mathematical models. The hydrograph of the plain groundwater unit that was derived from a 12-piezometer water level data set during a 198-month statistical