580 California St., Suite 400
San Francisco, CA, 94104

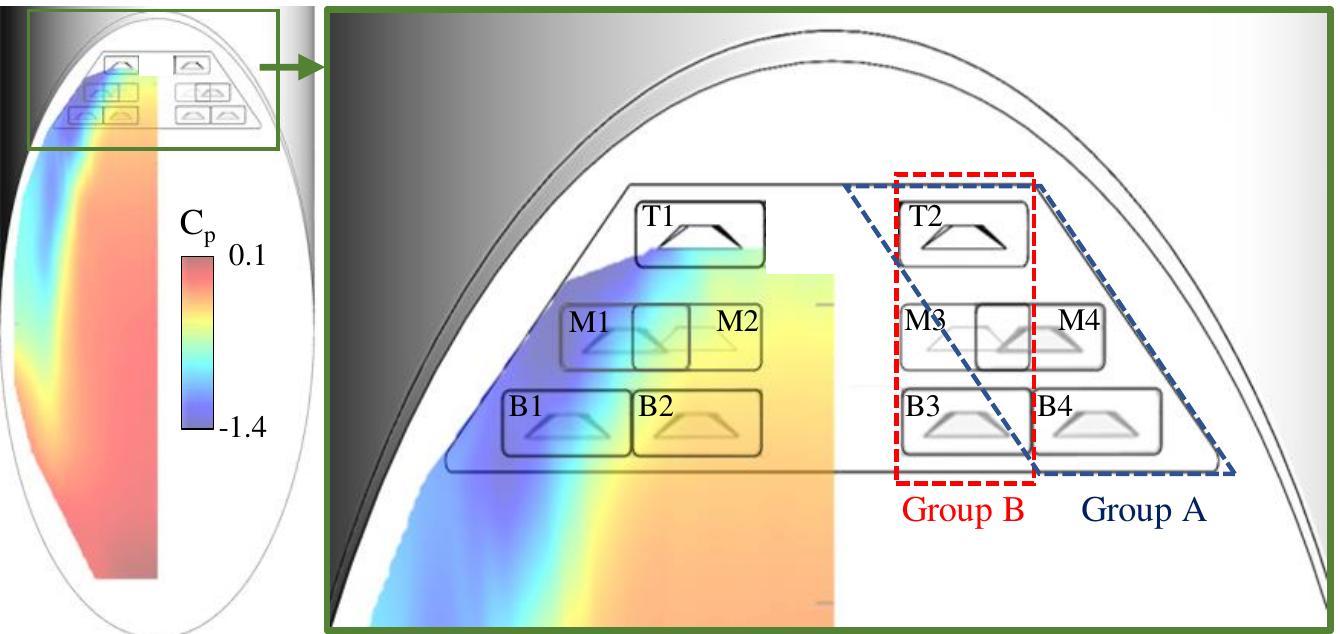
Figure 5 Baseline at Re=200,000: (a) Iso-surface with Q=0.1 for the illustrating the shape of the afterbody vortex pair; (b) Contours of surface pressure along with the trajectories of the afterbody vortex pair. coincide with the region of high surface pressure.