580 California St., Suite 400
San Francisco, CA, 94104

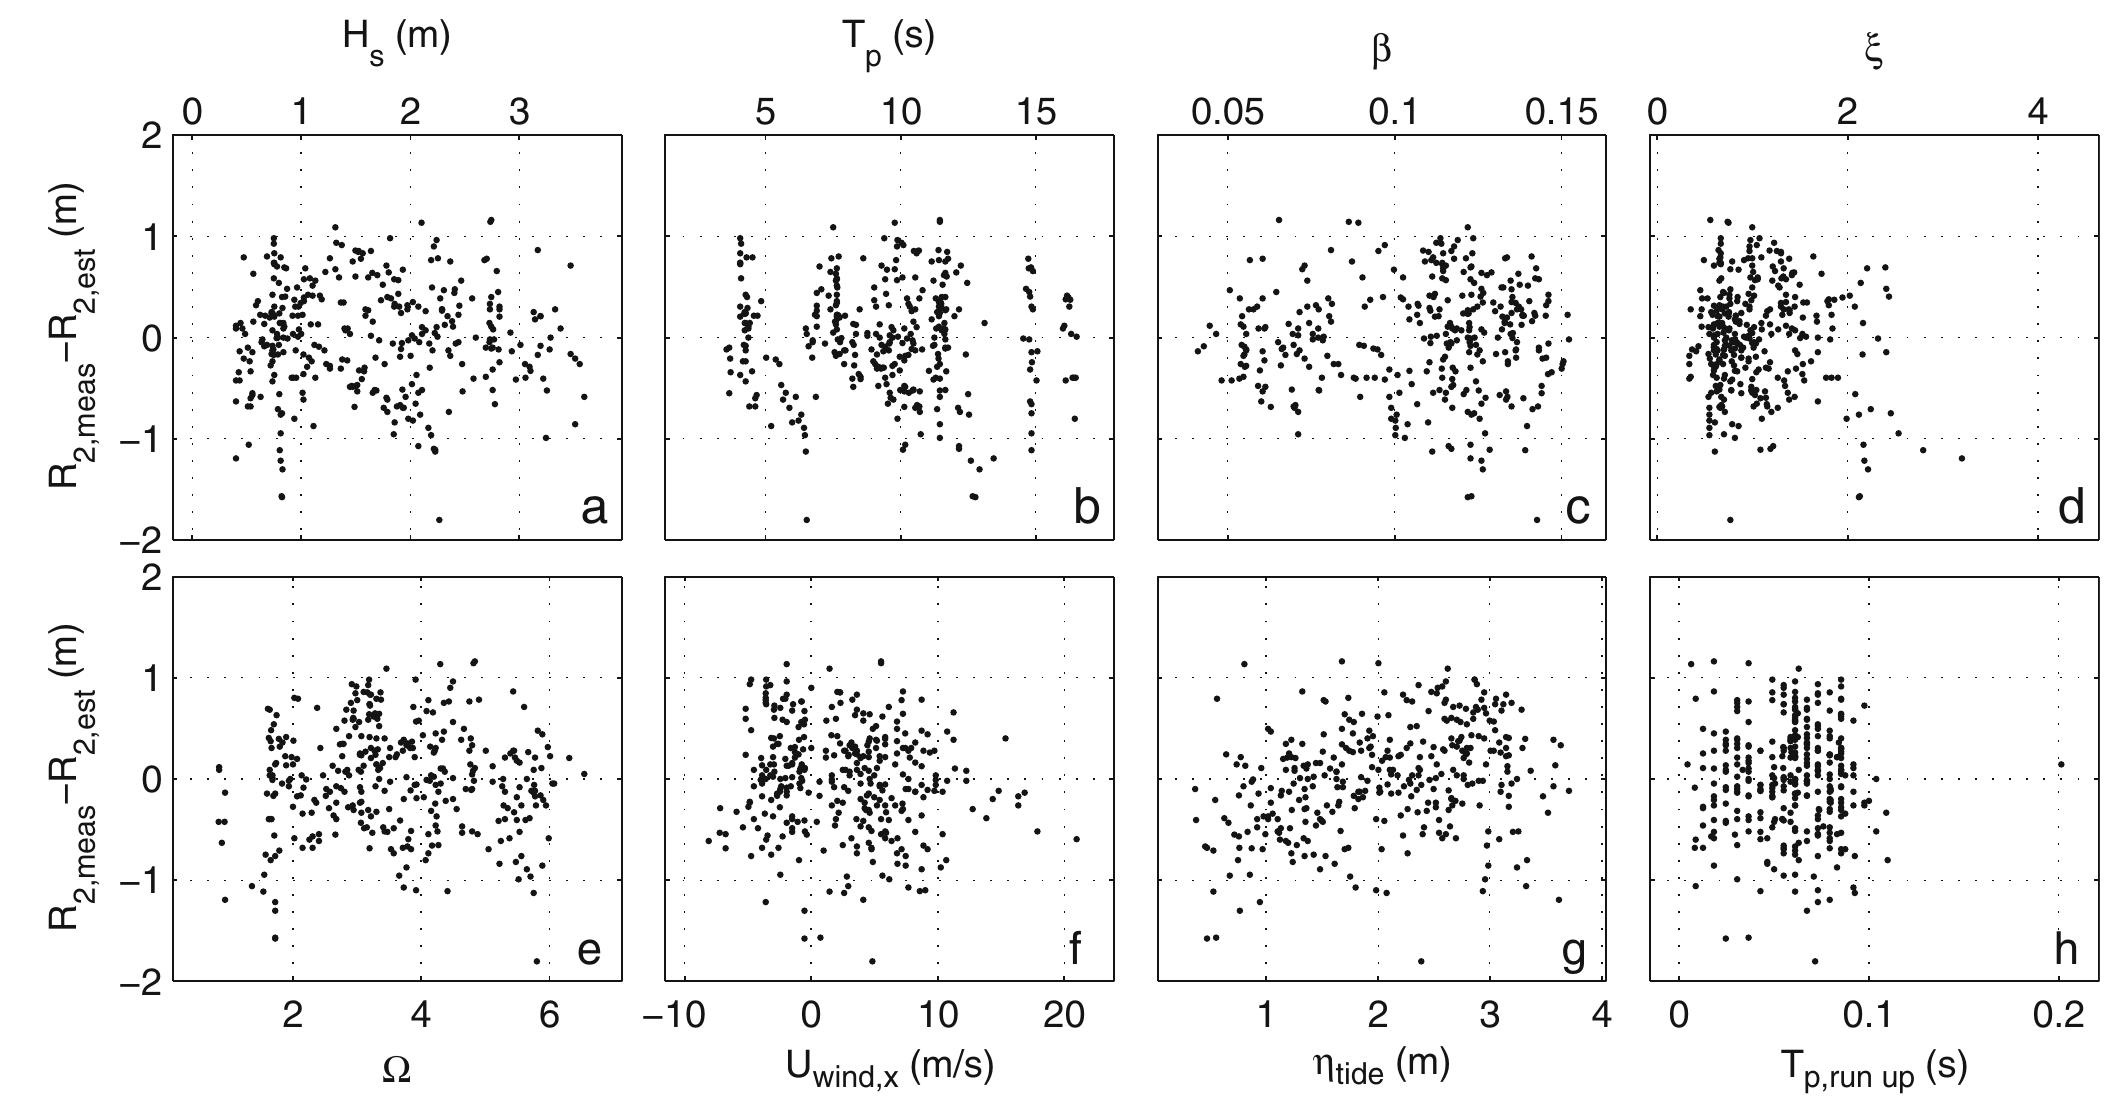
Figure 4 Scatter plots showing the three more accurate Ry wave run-up parameterizations (a—c; x-axis; see label for equation), as well as the values estimated with the Stockdon06 formula (d), versus the measurements (y-axis)