580 California St., Suite 400
San Francisco, CA, 94104

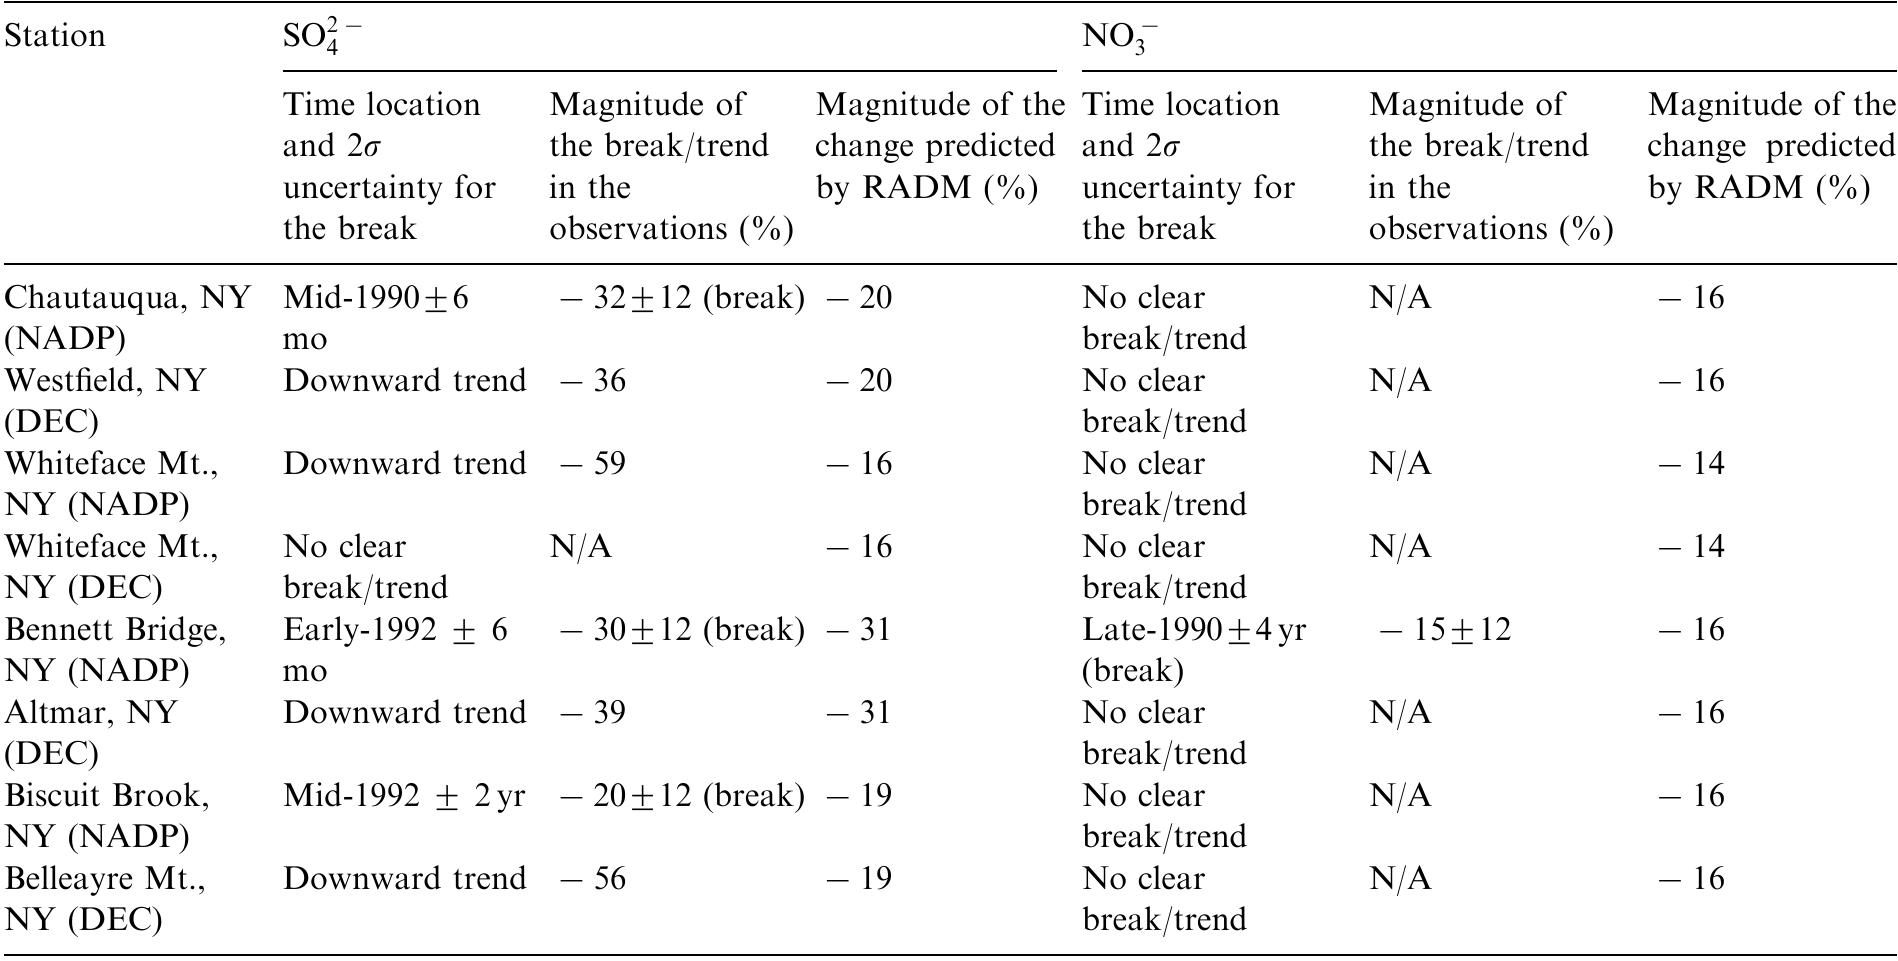
Figure 3 Time series data from Chautauqua during 1984-1998: (a) raw precipitation-weighted SO; ~ ; (b) precipitation-weighted SO; ~ smoothed with the KZ;-y,, 3 filter; (c) precipitation-weighted SO; ~ smoothed with a KZA4.,,, 3 filter, depicting a large break around 1990. All data were first log-transformed to reduce nonlinear effects and stabilize the variance.