580 California St., Suite 400
San Francisco, CA, 94104

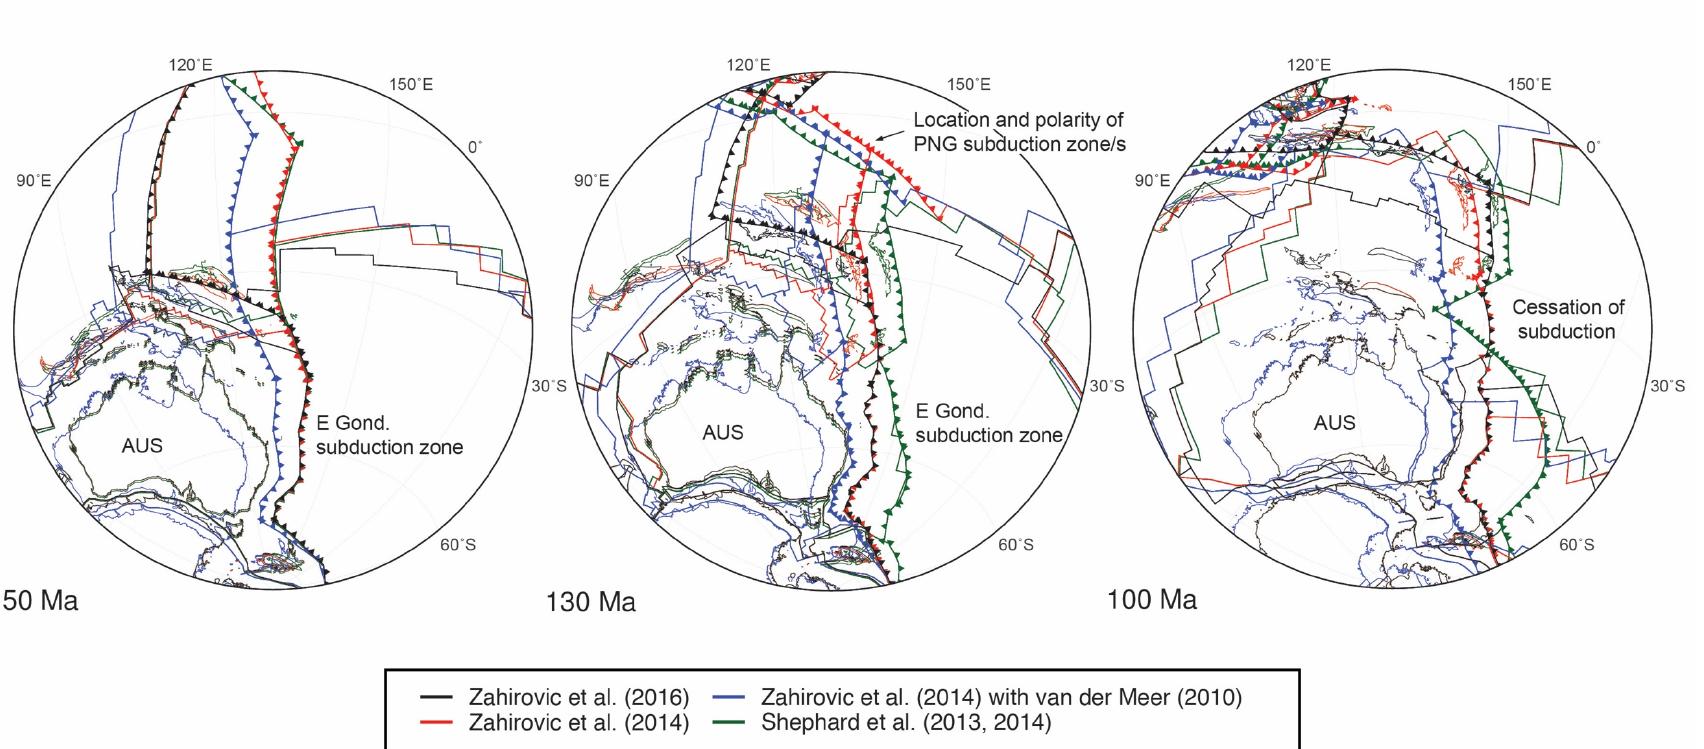
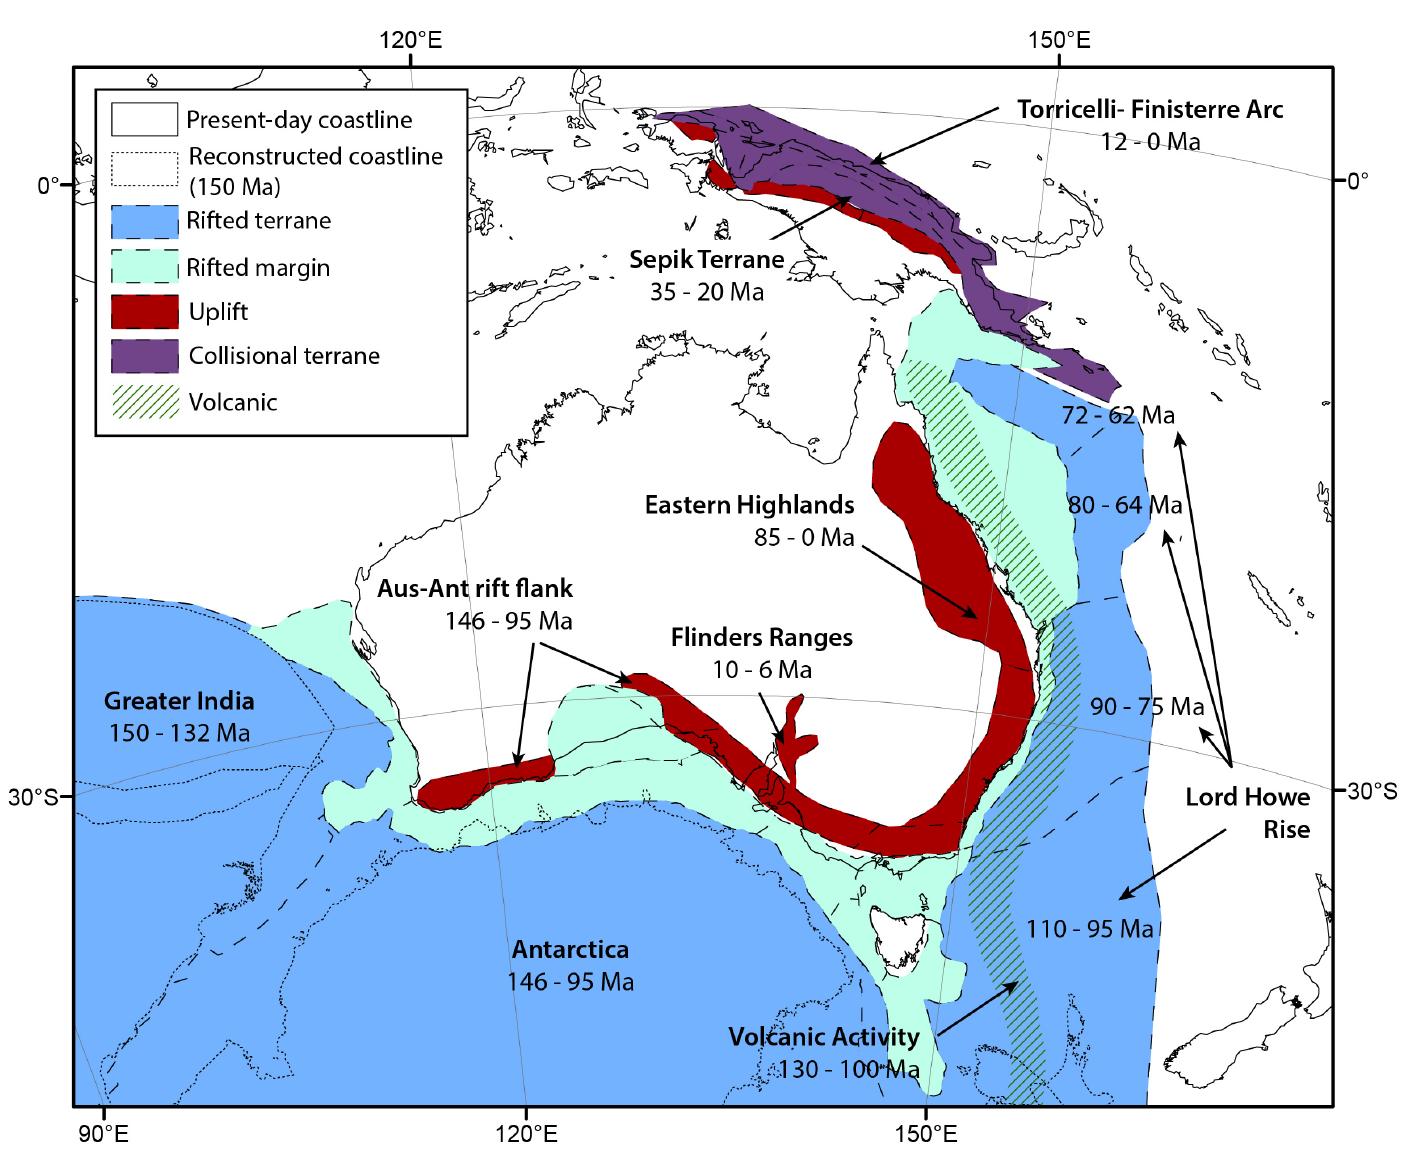
Figure 8 Time-dependent topographic evolution of LEMs and their match to corresponding paleogeographic snapshots from Struckmeyer and Totterdell (1990) (Paleoenvironment legend in Figure 2). Ocean areas below 1500 m below sea level are not shown. Model M4, our preferred model (P), produces flooding of the Eromanga Sea from ~135 Ma, beginning its retreat northward through from 105 Ma.