Figure 6 Variation of cumulative density of mitigation options MM with time f for different values of A,
Related Figures (9)
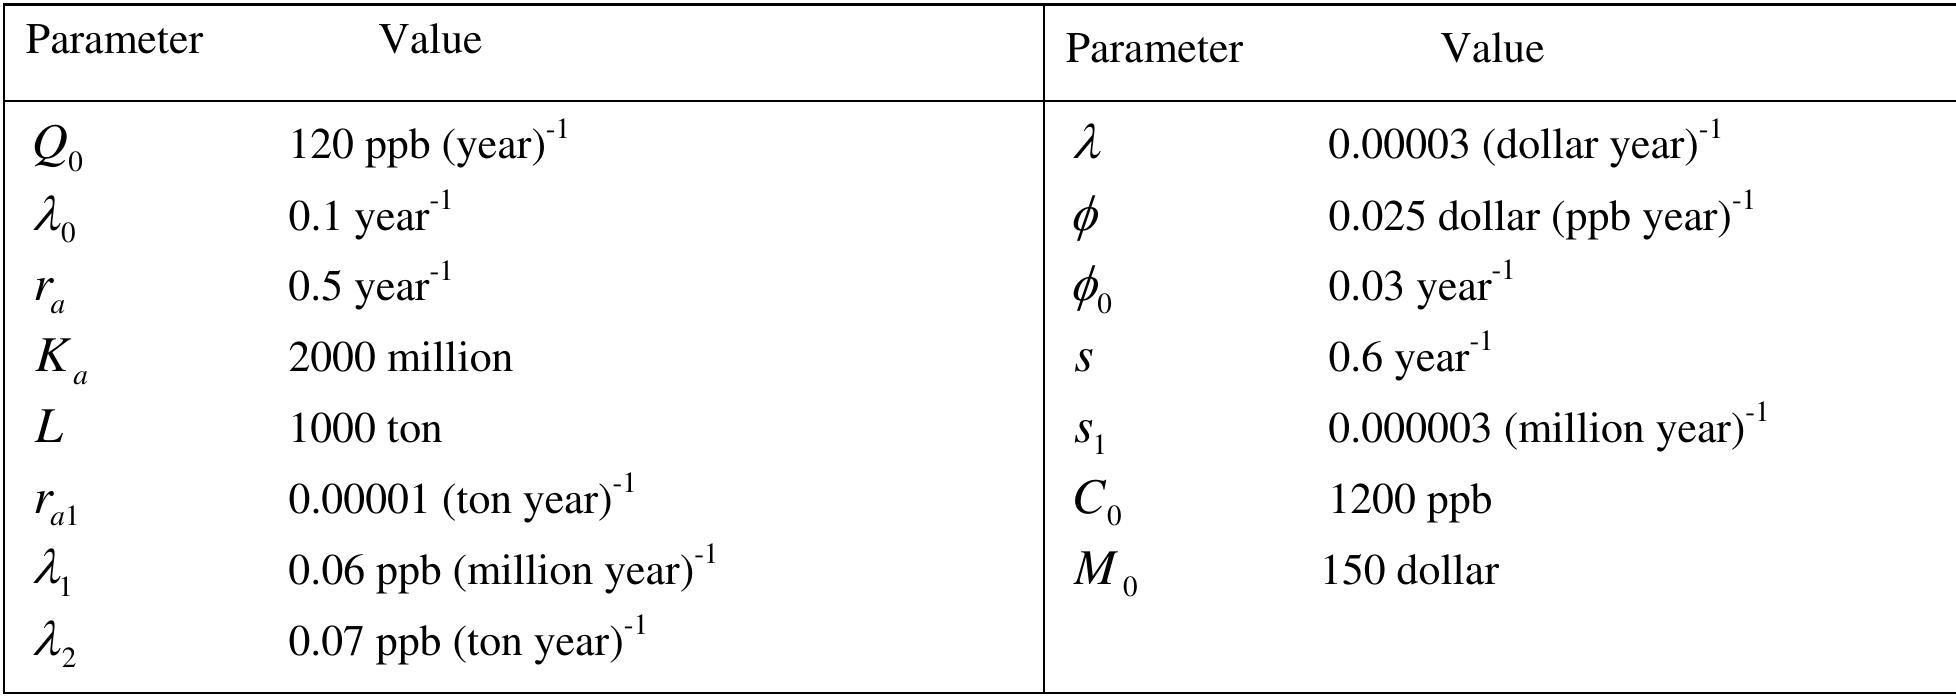
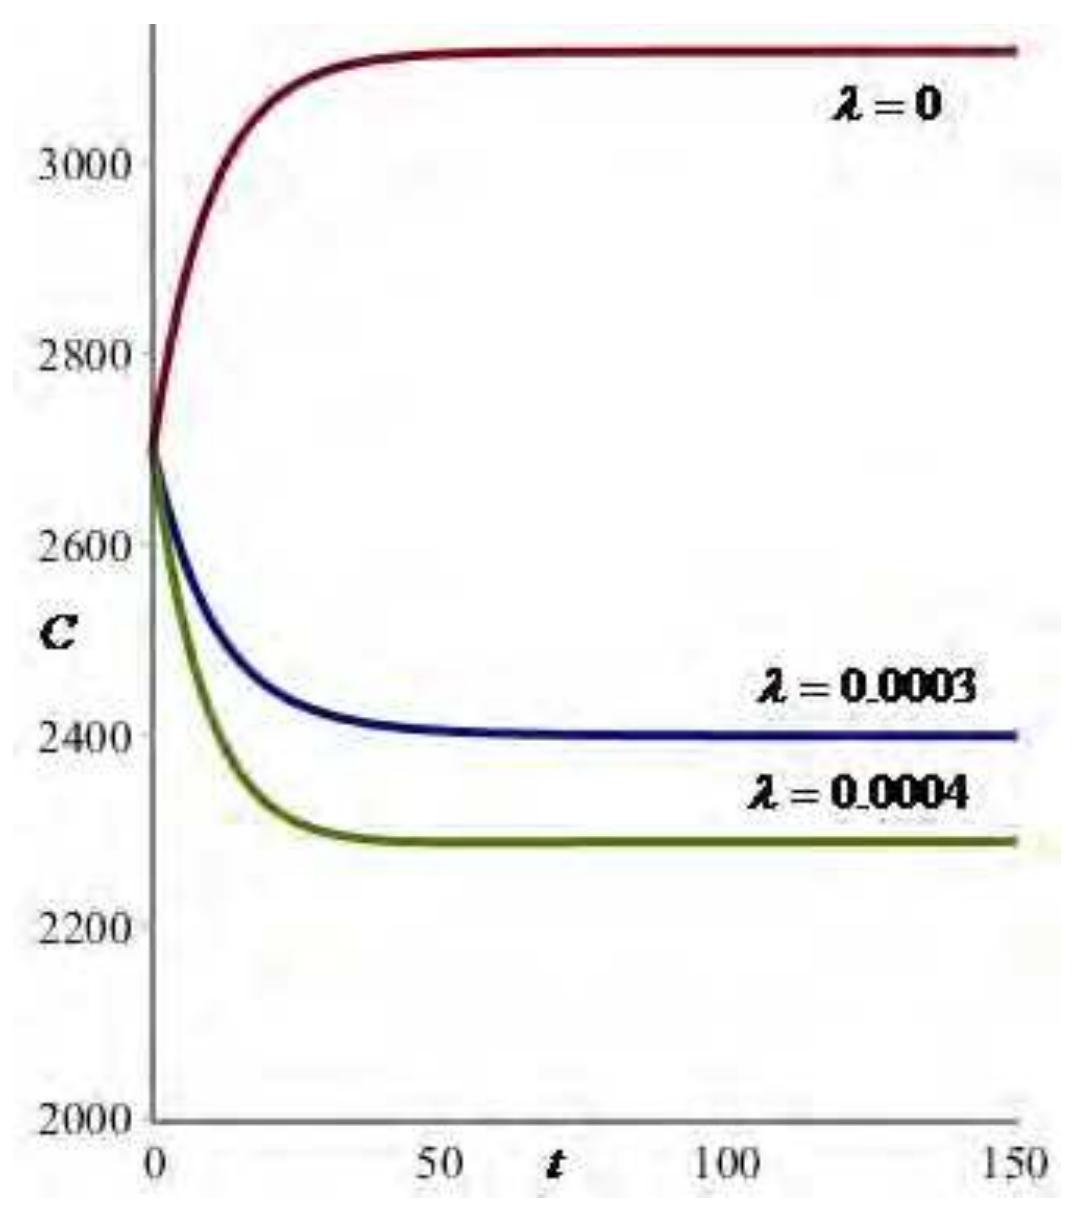
In order to analyze the model system (1) - (4), the following lemma is stated without proof. The model system (1) — (4) has four equilibria namely, Consider a positive definite function as, Table 1 Parameter values for the model system (1) — (4). The equilibrium values of different variables in E are obtained as follows. Fig. 3 Variation of atmospheric concentration C of methane with time ¢ for different values of A, From these figures, it is found that as the emission rate coefficients of methane due to livestoc Fig. 4 Variation of atmospheric concentration C of methane with time ¢ for different values of ”) | Fig. 5 Variation of atmospheric concentration C of methane with time ¢ for different values of A. Fig. 7 Variation of cumulative density of mitigation options MM with time f for different values of Ag ;


