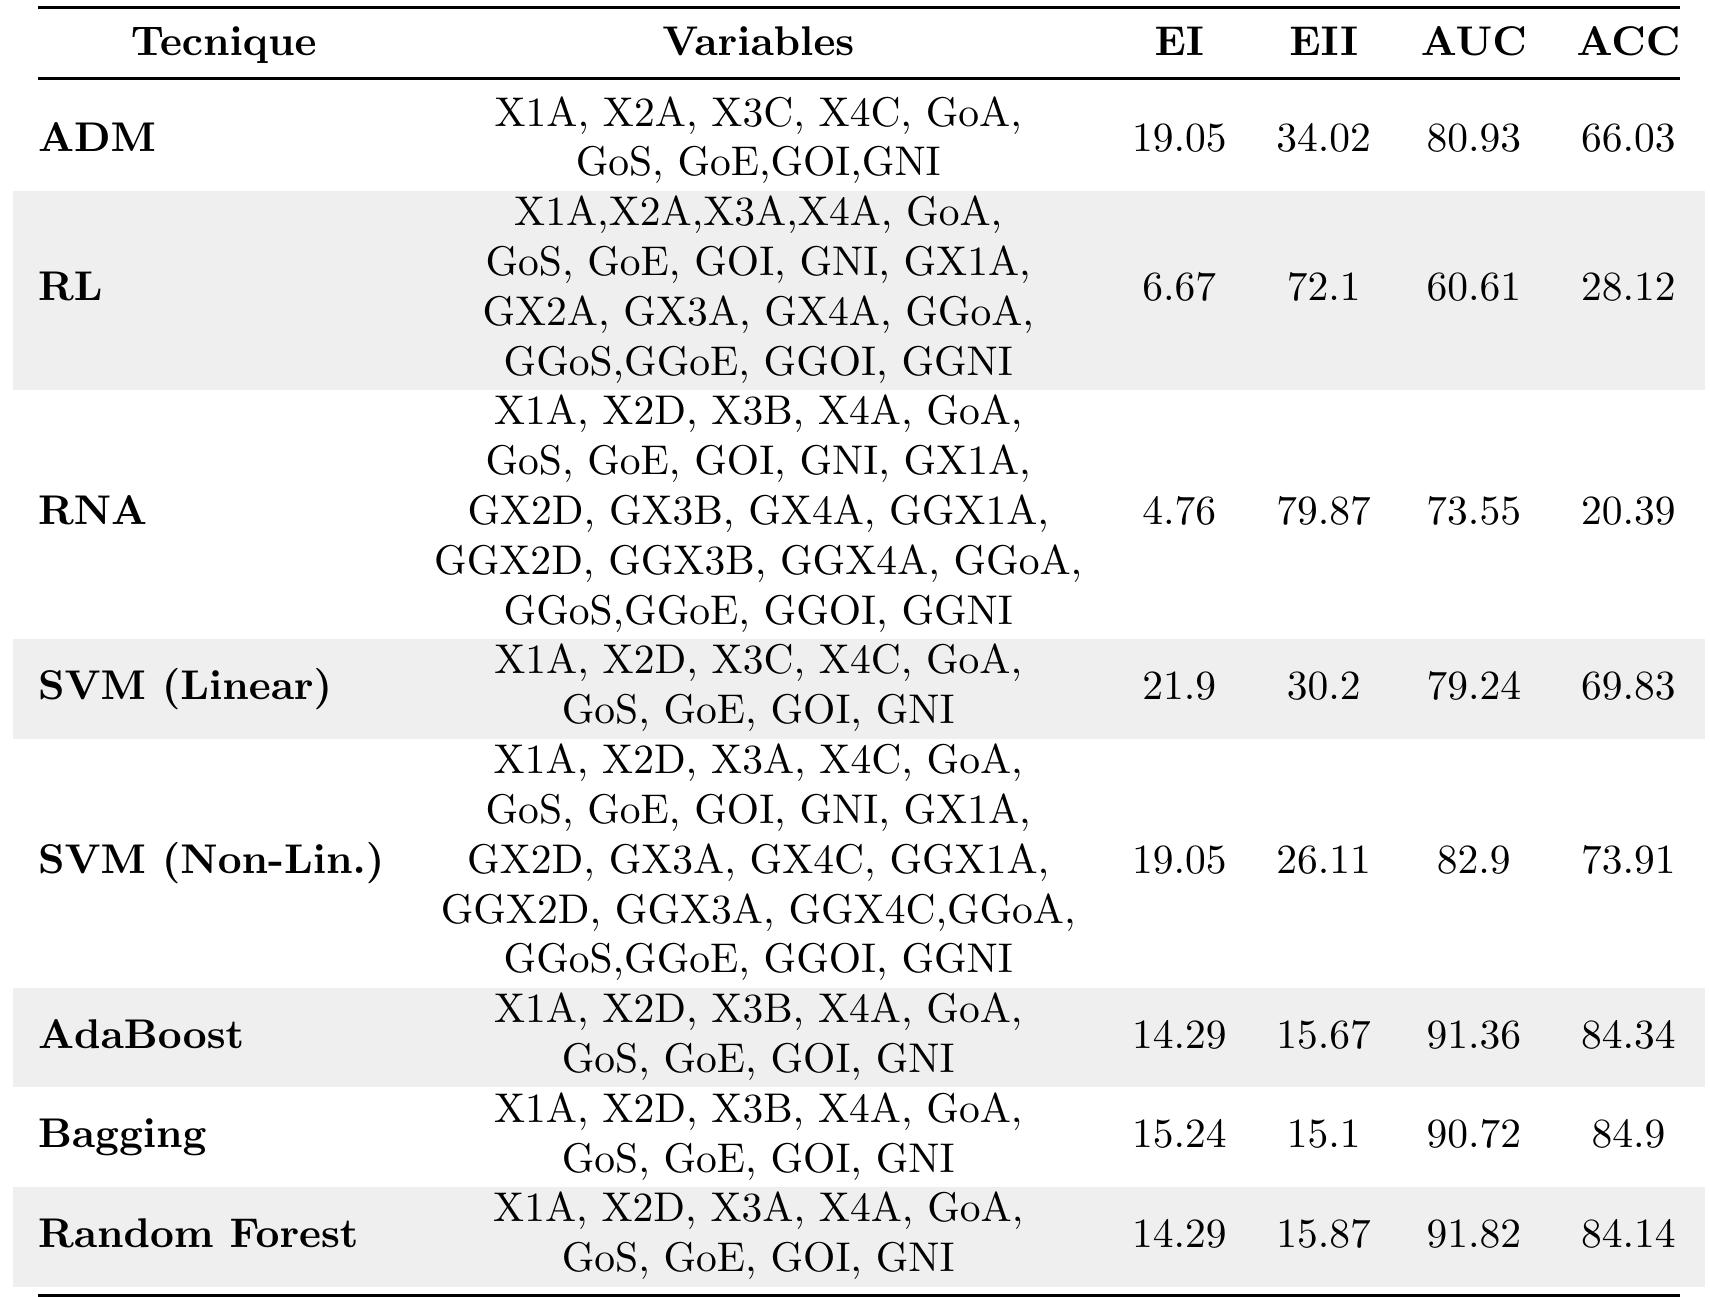
Table 6 Best results found for each technique in terms of Type II Error. All measures are in percentage terms.
Related Figures (8)
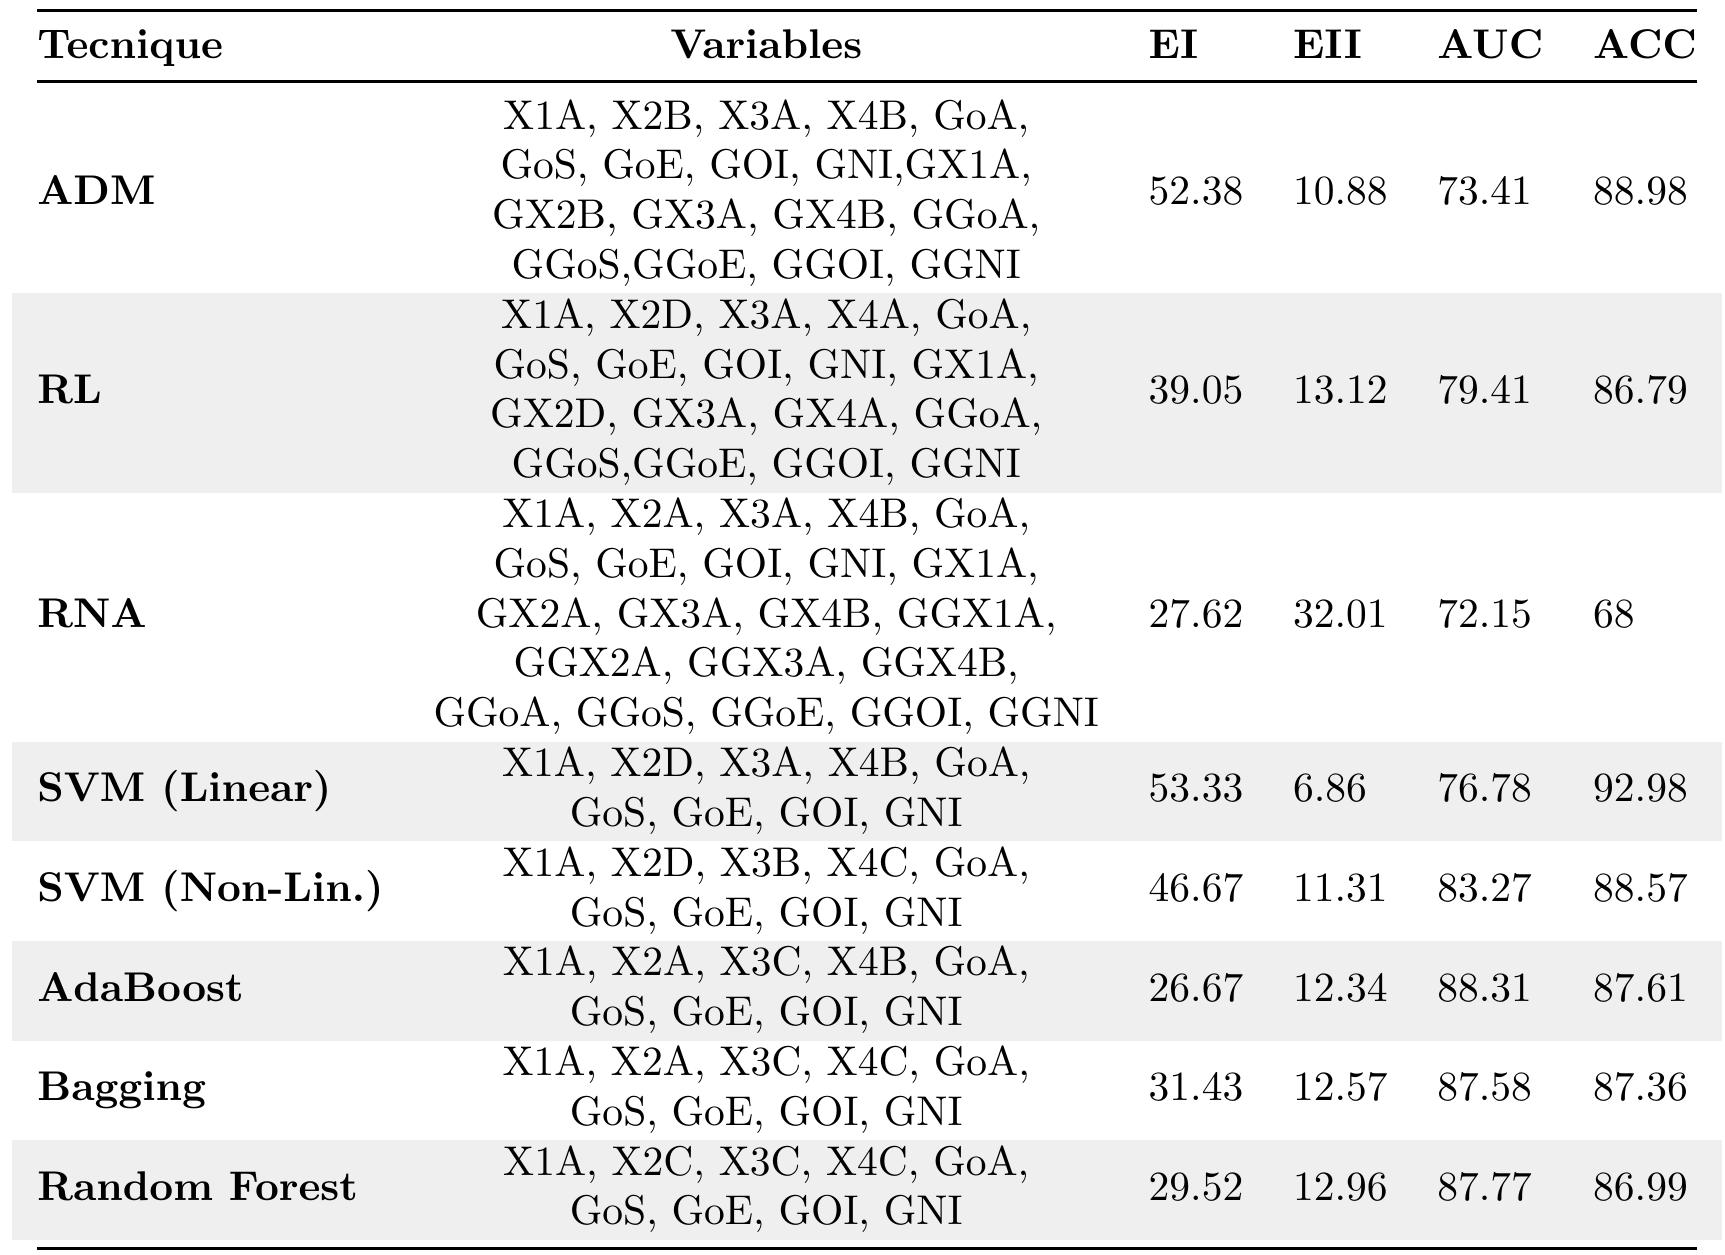
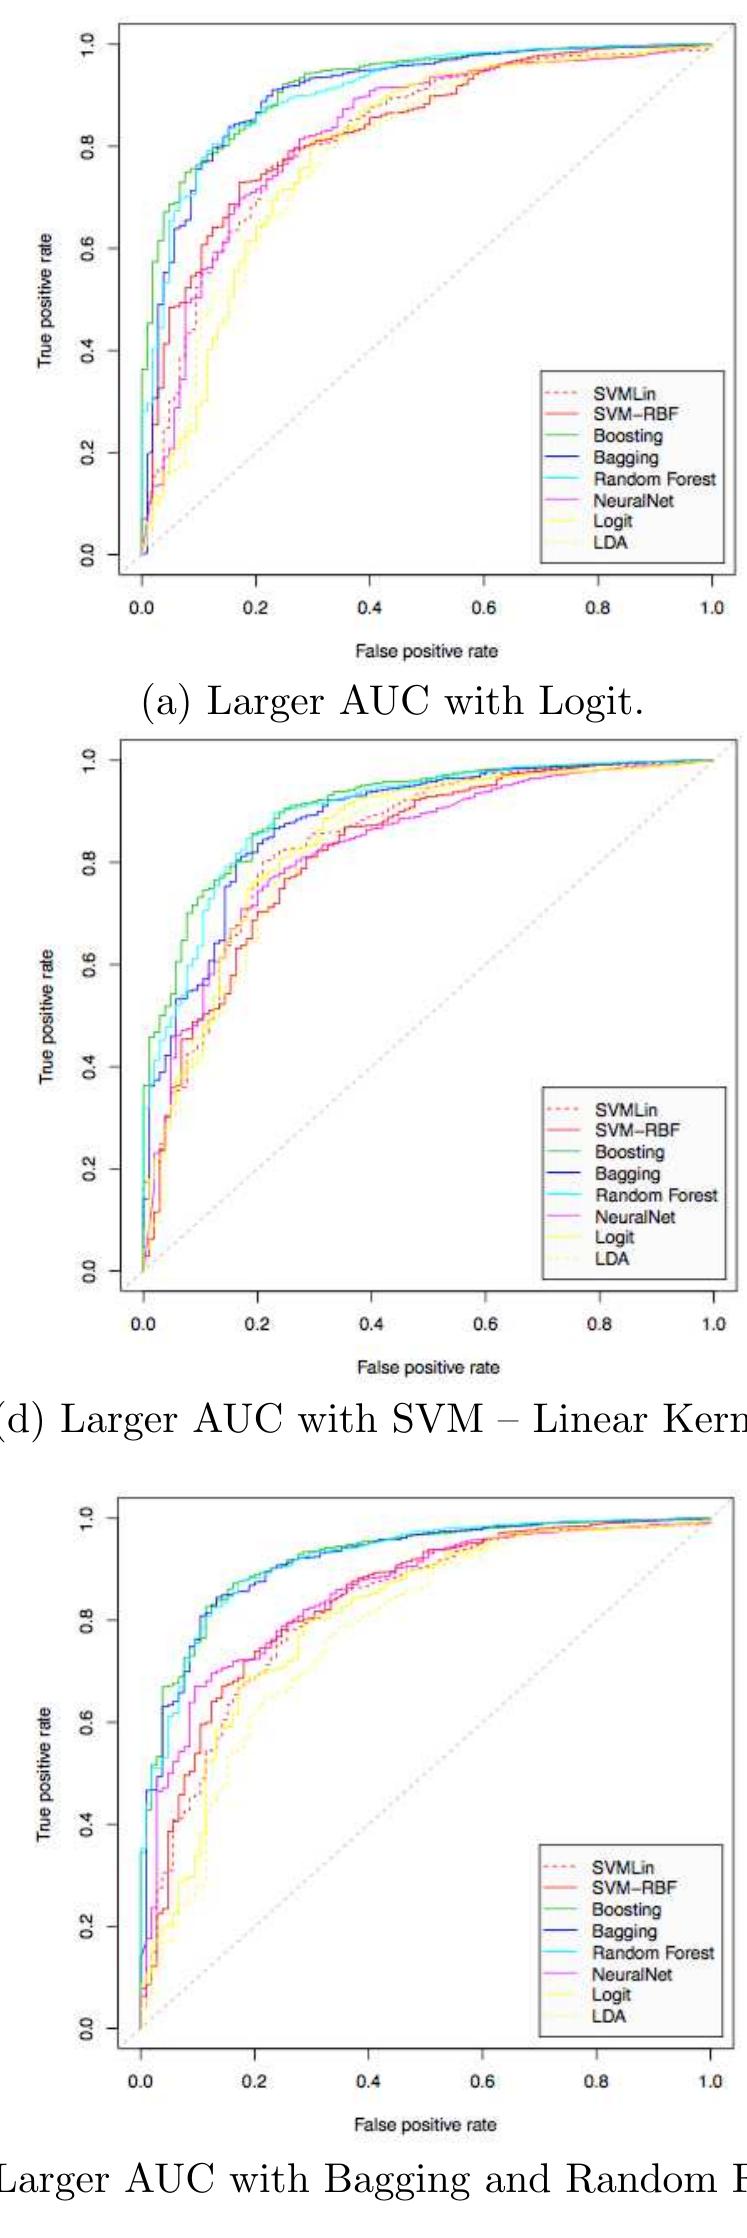
Table 1: Description of the Variables used in the research, indicating type and code. Table 2: Descriptive Statistic of the training sample data separating bankrupt companies (F) from non-bankrupt companies (NF). Table 4: Best results found for each technique in terms of area under ROC curve. All measures are in percentage terms. Figure 1: Graphics of the ROC curves of the three top performing computational models, illustrating the best results, in terms of AUC. The curves in each graph also indicate the performance of the other methods, but applied under the same conditions — subsamples and variables. Table 5: Best results found for each technique in terms of Type I Error. All measures are in percentage terms.
Connect with 287M+ leading minds in your field
Discover breakthrough research and expand your academic network


