580 California St., Suite 400
San Francisco, CA, 94104
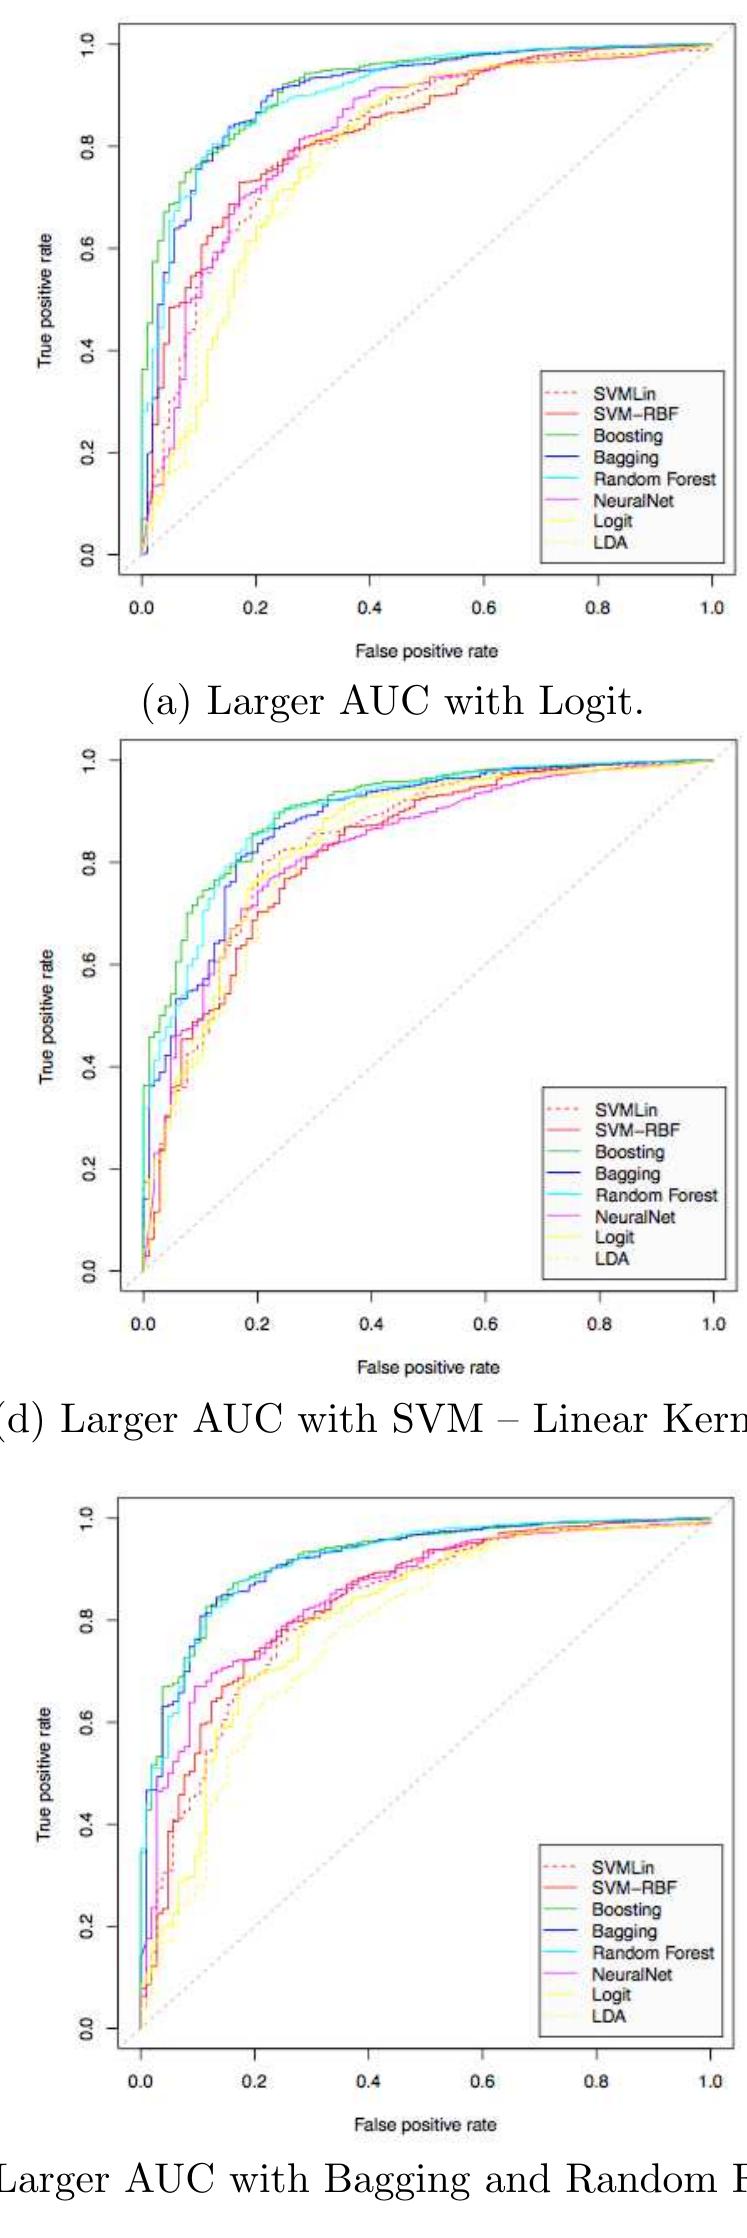
Figure 1 Graphics of the ROC curves of the three top performing computational models, illustrating the best results, in terms of AUC. The curves in each graph also indicate the performance of the other methods, but applied under the same conditions — subsamples and variables.