Figure 3 Urease, protease, phosphatase, and f-glucosidase activities in polluted and control soils at different times after contaminant addition. For abbreviations see Fig. 1.
Related Figures (5)
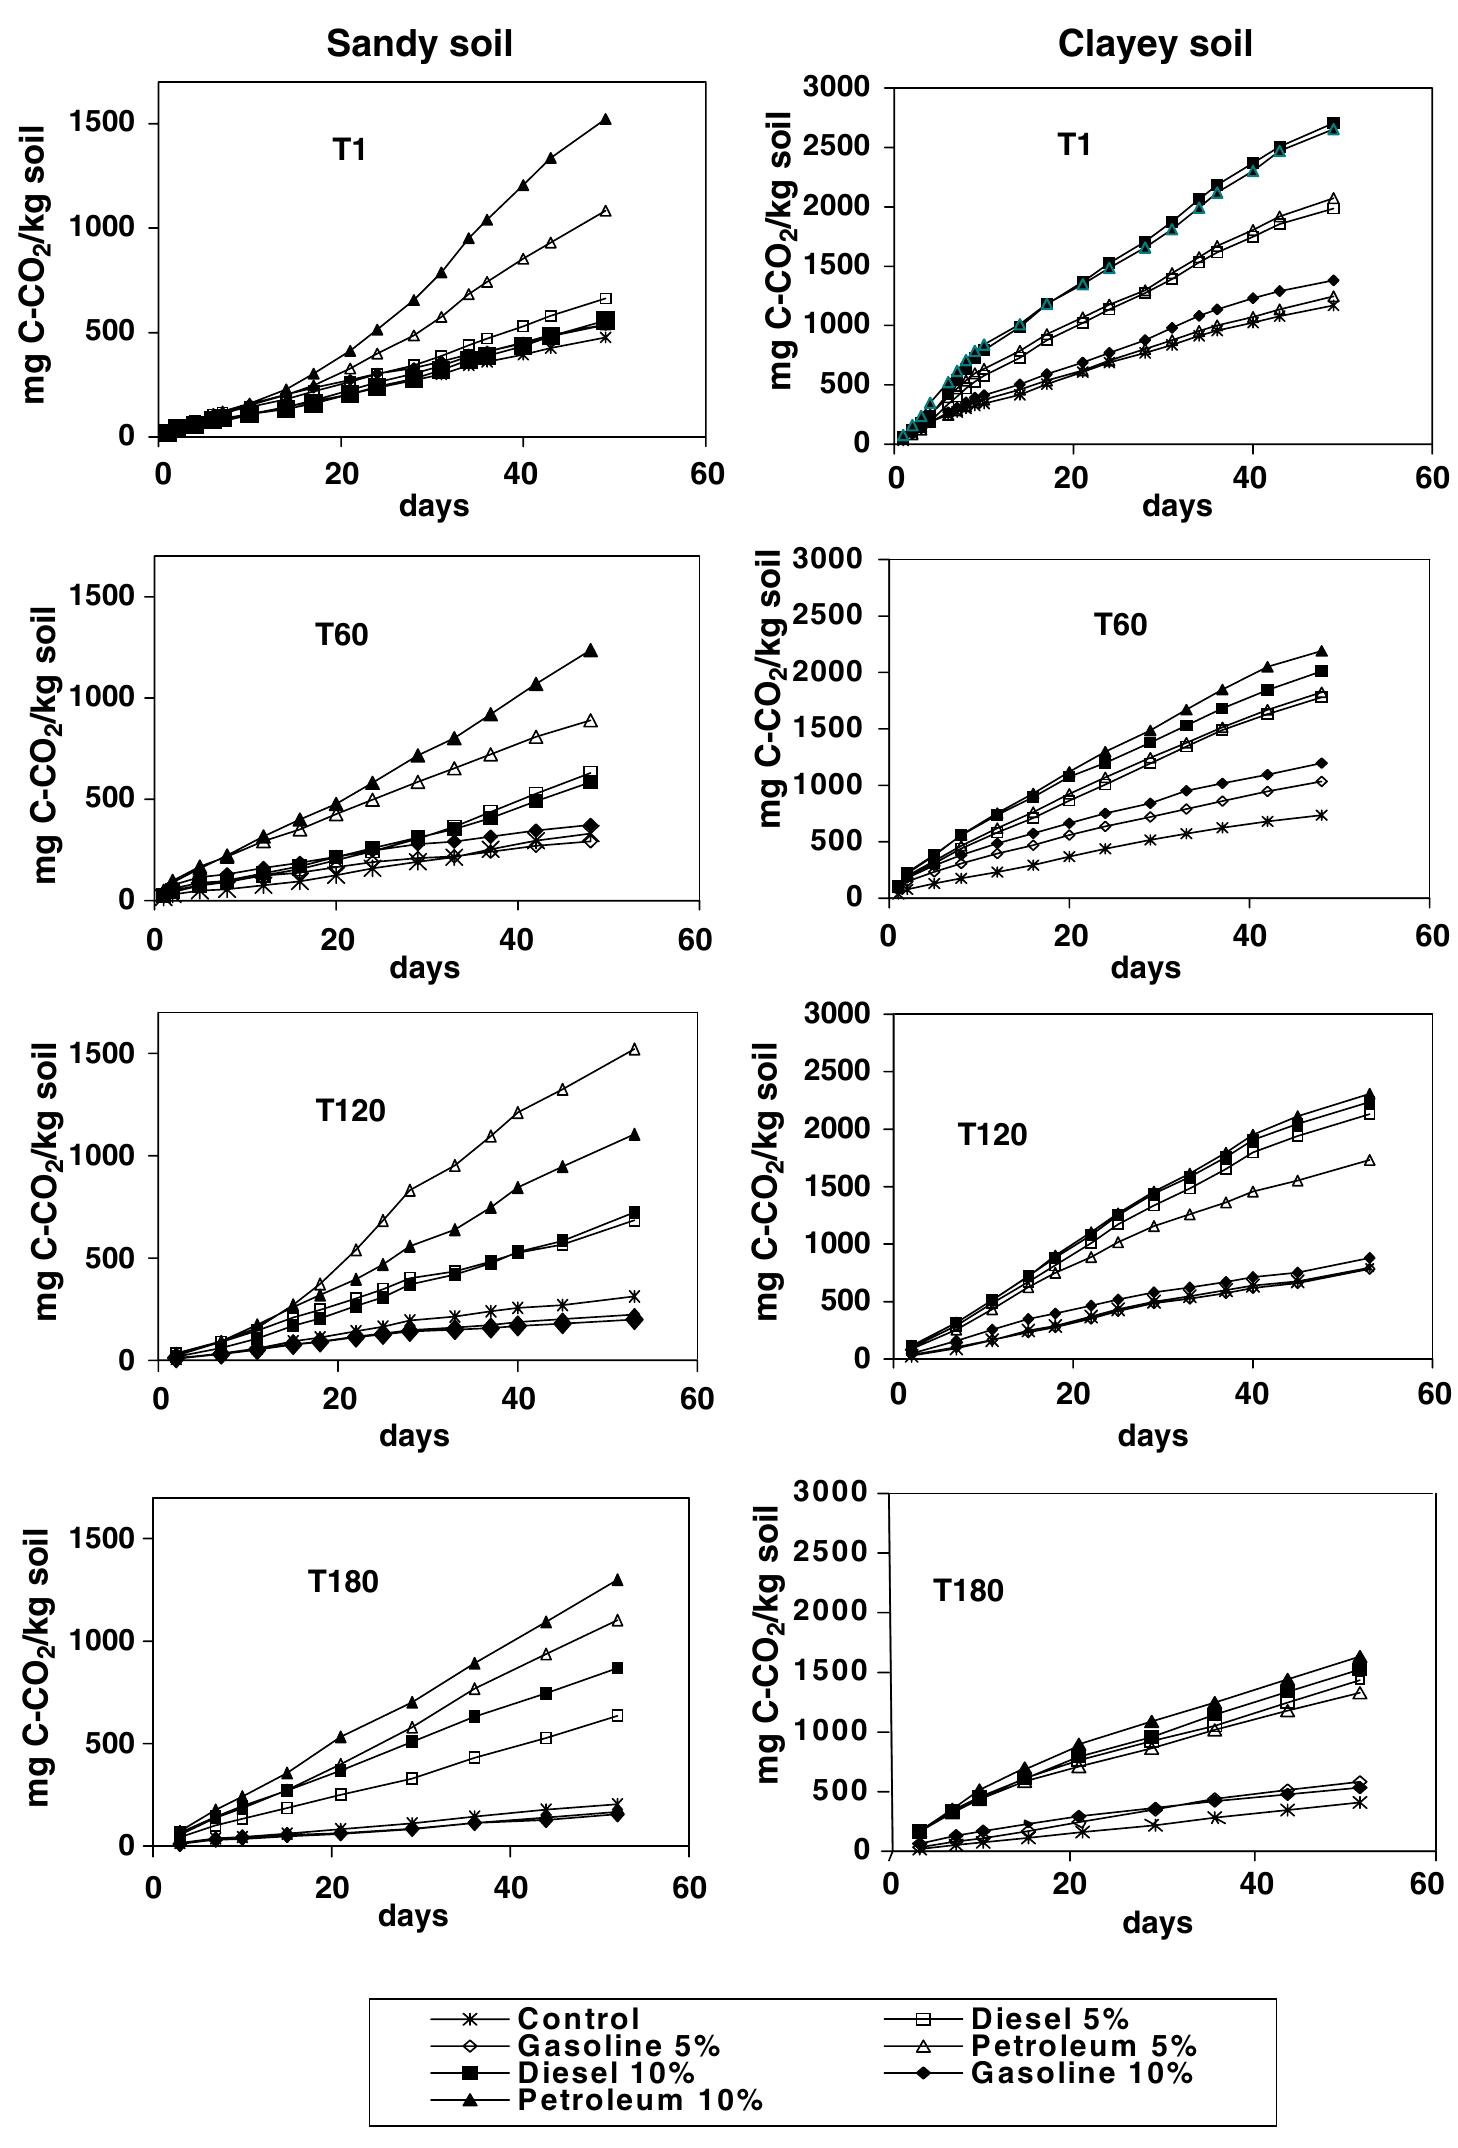
Characteristics of the soils Fig. 1. Microbial biomass carbon in polluted and control soils at different times after contamination. T1, T60, T120 and T180: soil samples taken 1, 60, 120 and 180 days after soil contamination. LSD: least significant difference (p < 0.05) between mean values of each treatment at a particular sampling time. Fig. 2. Cumulative losses of CO2-C from the polluted and control soils in samples taken immediately after hydrocarbon contamination (T1), and 60 (T60), 120 (T120) and 180 (T180) days after contamination. Least significant difference (LSD) between means for each parameter and soil at a given sampling time Fig. 4. Germination Index (GI) of barley and ryegrass seeds in polluted soils at different times after the addition of contamination (Control GI = 100%). For abbreviations see Fig. 1.


