Figure 1 layers. This happens through Eq 10. The last step is updating weights of the CNN using calculated gradient
Related Figures (13)
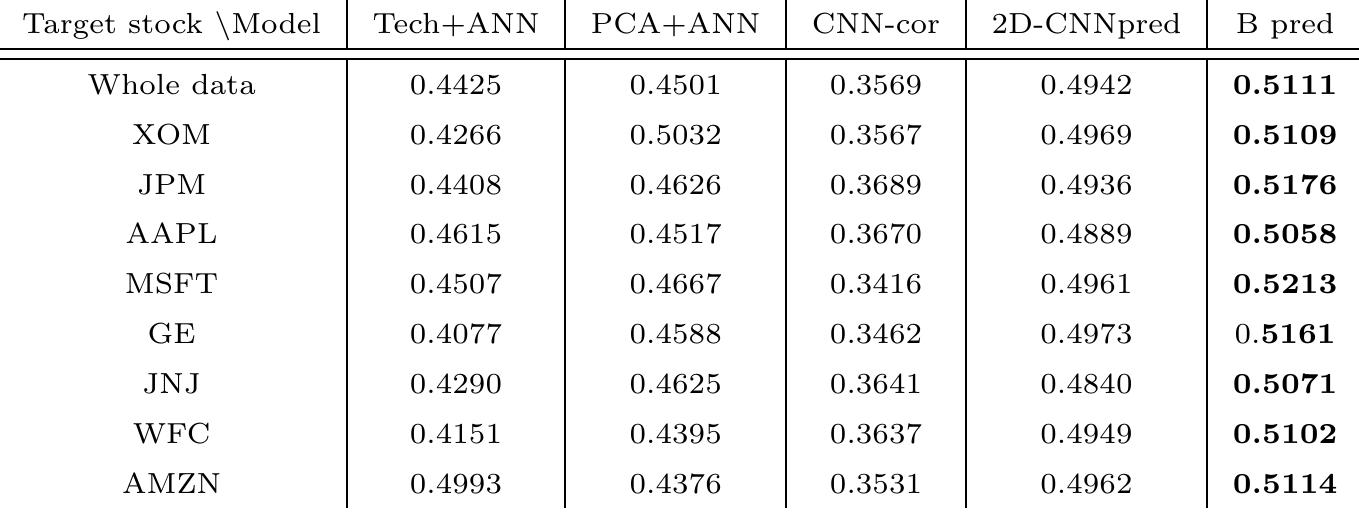
that fits the problem. called the base predictor. 4.3. Transfer learning a graphical visualization of what we described just now. Figure 1: Graphical Visualization of 2D-CNNpred (Hoseinzade & Haratizadeh, 2019) Table 3: Description of used algorithms Table 4: F-measure of some of the stocks in S&P 500 index Figure 2: Performance of algorithms in having the best F-measure for predicting each of the 458 stocks Table 5: F-measure of base predictor with different layers Table 6: F-measure of algorithms in prediction of U.S. indices Table 7: F-measure of algorithms in prediction of world's famous indices The list of features that were used in this research is represented in Table 8: References \hmadi, E., Jasemi, M., Monplaisir, L., Nabavi, M. A.. Mahmoodi, A., & Jam, P. A.


