580 California St., Suite 400
San Francisco, CA, 94104
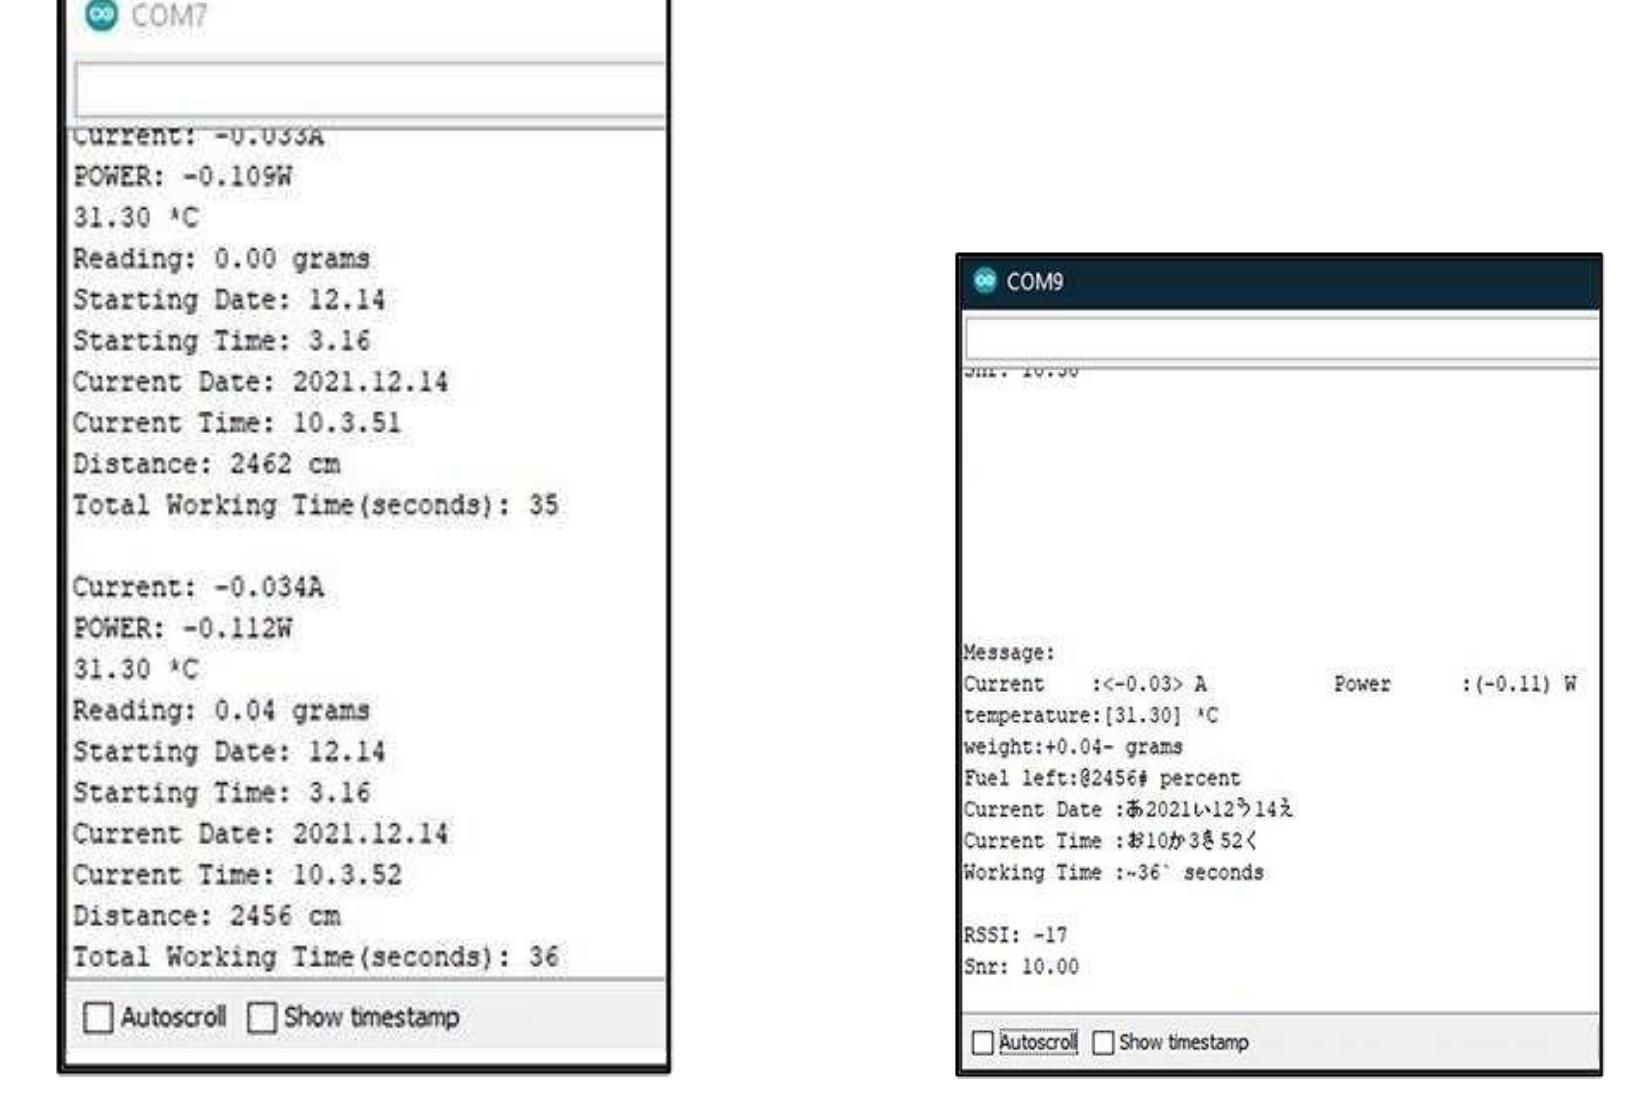
Figure 6 Receiver’s serials monitor display Figure 5. Transmitter’s serials monitor display Figure 5 shows the display from the serial monitor of Arduino software when a transmitter sends data dan Figure 6 shows the serial monitor from the Arduino software when a receiver receives data. The measured items are current, power, temperature, weight, date and time, a distance that will be used to detect the fuel oil in the crane, and total working time for the crane. In addition, the signal to noise ratio (SNR) and received signal strength indication (RSSI) values of the LoRa module is also displayed in the serial monitor of the receiver side. SNR and RSSI indicate the signal strength for LoRa.