580 California St., Suite 400
San Francisco, CA, 94104

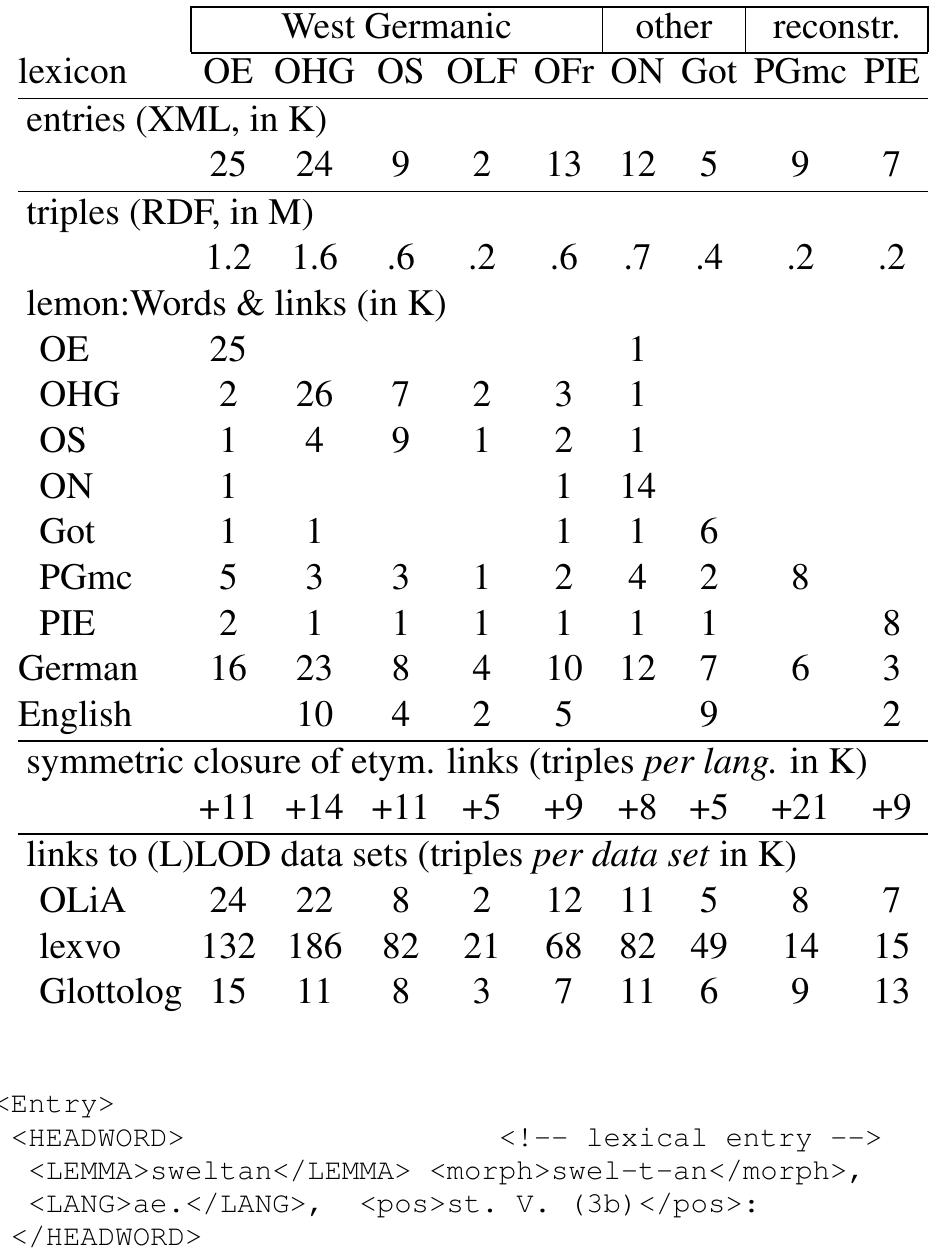
Figure 1 Matrix transformed into a graph Table 2 can algorithmically be transformed into a graph by assigning the row and column labels as vertices and con- necting them via edges for cells that have a “1”. The result of this transformation is illustrated in Figure 1.