


580 California St., Suite 400
San Francisco, CA, 94104
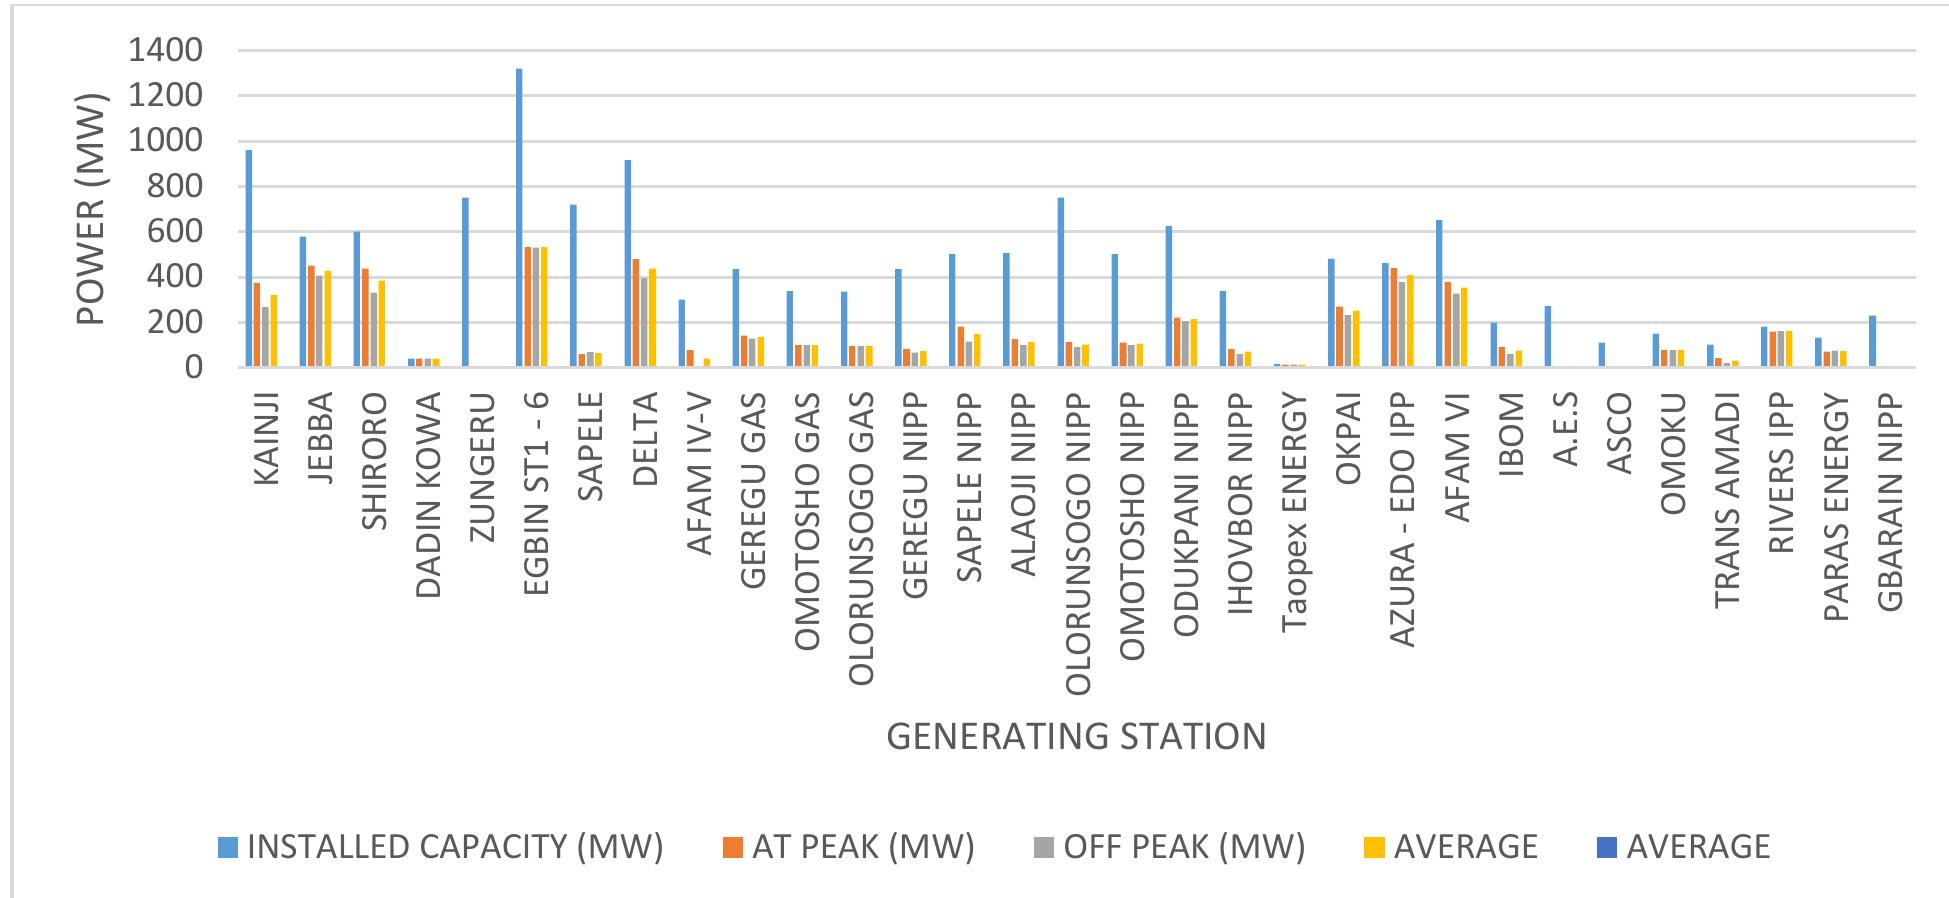
Figure 4 1: Generating Station Capacity ait. EAOSULLS GAMU B7ISLUSSIVUEIE Table 3.1 shows that over the research period, there were 101 voltage collapses on the grid, or an average of almost 11 collapses annually. Also, in Fig 4.1, the installed capacity of each generating station connected to the grid provides the average at-peak and off-peak values in the period under review. Nigeria's grid installed capacity stands at about 14,000MW and has a generating peak value of about 5,200MW and an off-peak value of about 4,400MW. Furthermore, this means that the grid is generating an average of 4,8300MW which translates to about 34.64% of the installed capacity as shown in table 4.1. This average is very poor for a country with so much enormous potential and resources both human and natural. Also, it can be seen (in Figure 4.2) that in 2016 the nation experienced the highest number of voltage collapses 28 times and in 2023 it had the lowest with 2. Figure 3 shows that in the period under review, more collapses occurred in January, May, and June with the frequency of occurrence of 17, 14, and 13 respectively. We can also see that Zungeru although newly commissioned is yet to contribute to the grid, others include AES, ASCO, Trans- Amadi and Gbarain NIPP have not been contributing recently to the grid due to various reasons ranging from poor maintenance, vandalization, OEMs issues, spares, gas constraints, etc.


