Figure 10 Poloidal view of the MCNP HCLL DEMO model filled with materials: numbers identify the blanket modules involved in the NWL calculations.
Related Figures (11)
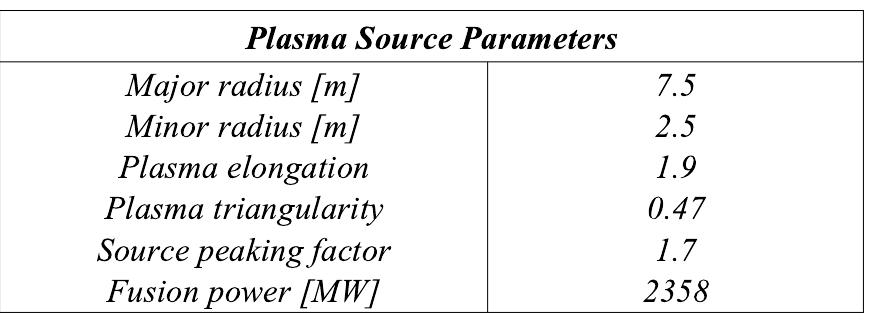
Fig. 1. Conversion of a PbLi brick used in HCLL TBM mock-up experiment. Top-left panel: native step file. Top-right panel: McCad GUI displaying the geometry. Bottom left: generated MCNP model. Bottom right: MCNP geometry displayed with a Sabrina tool plot. Fig. 2. KT4&KH2 UV-optical spectrometer installed at JET. Fig. 4. Residual B-spline surfaces in the first collimator CAD file (left) and the second collimator pipe-to-pipe connection (right) that McCad is not able to convert. Fig. 3. KT4&KH2 model simplified and divided into four independent files. Fig. 5. Volumes of the solids composing the KT4&KH2 diagnostic system calculated using the MCNP converted model and the CAD files. DEMO PLASMA SOURCE PARAMETERS USED IN NWL CALCULATIONS Fig. 9. Volume ratio (MCNP calculation/McCad output) versus cell numbers estimated using the converted HCLL DEMO model. Fig. 11. NWL poloidal distribution on the blanket modules 1-13. Data are normalized to 2358 MW fusion power (8.468E + 20 n/s).


