580 California St., Suite 400
San Francisco, CA, 94104

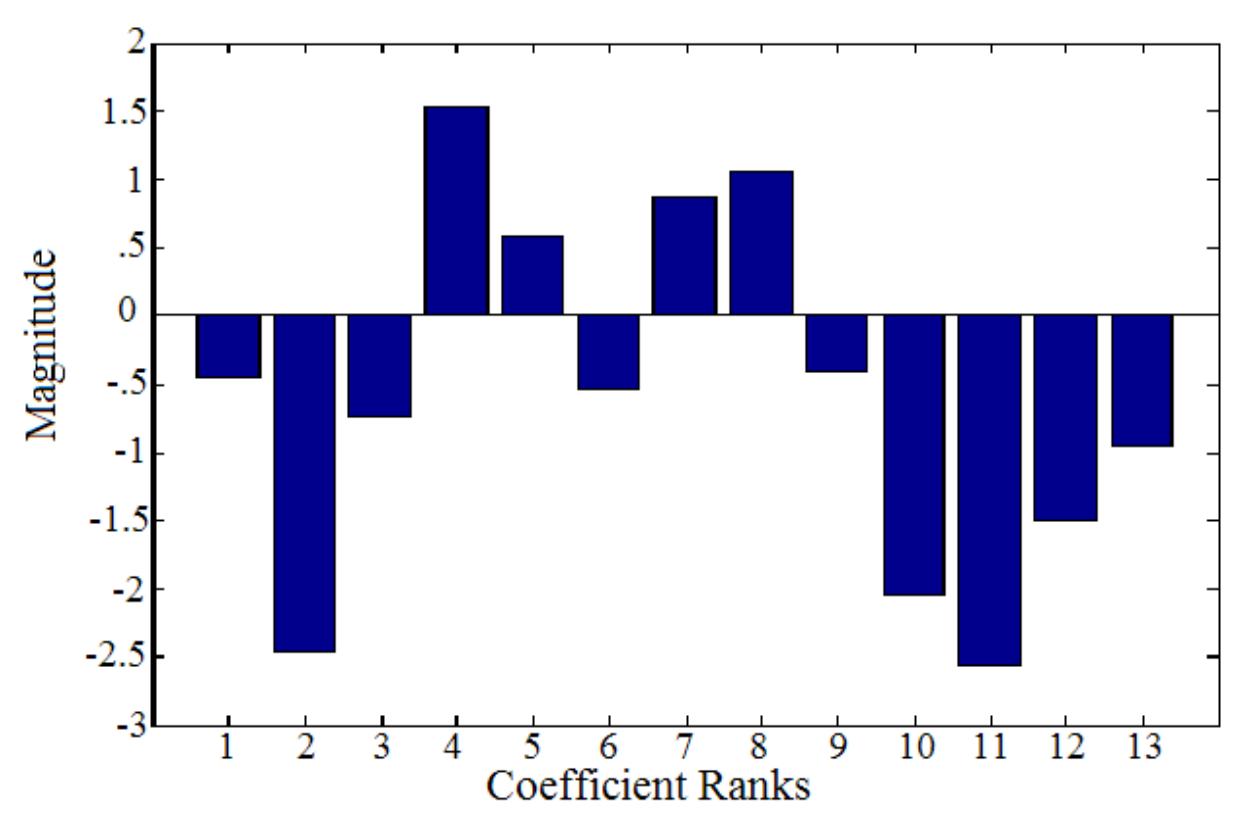
Figure 22 Amount of category and emotion rating data explained for each principal component This figure illustrates the category (solid) and emotion (dashed) changes in the percent explained from the first principal component, to the second principal component. This value of percent explained tells how much of the category or emotion rating data respectively, is explained by the principal component.