Table 3 Different kernel functions used in the study. x;andx; are vectors in the input space, d, r, and y are the kernel parameters. Table 3
Related Figures (8)
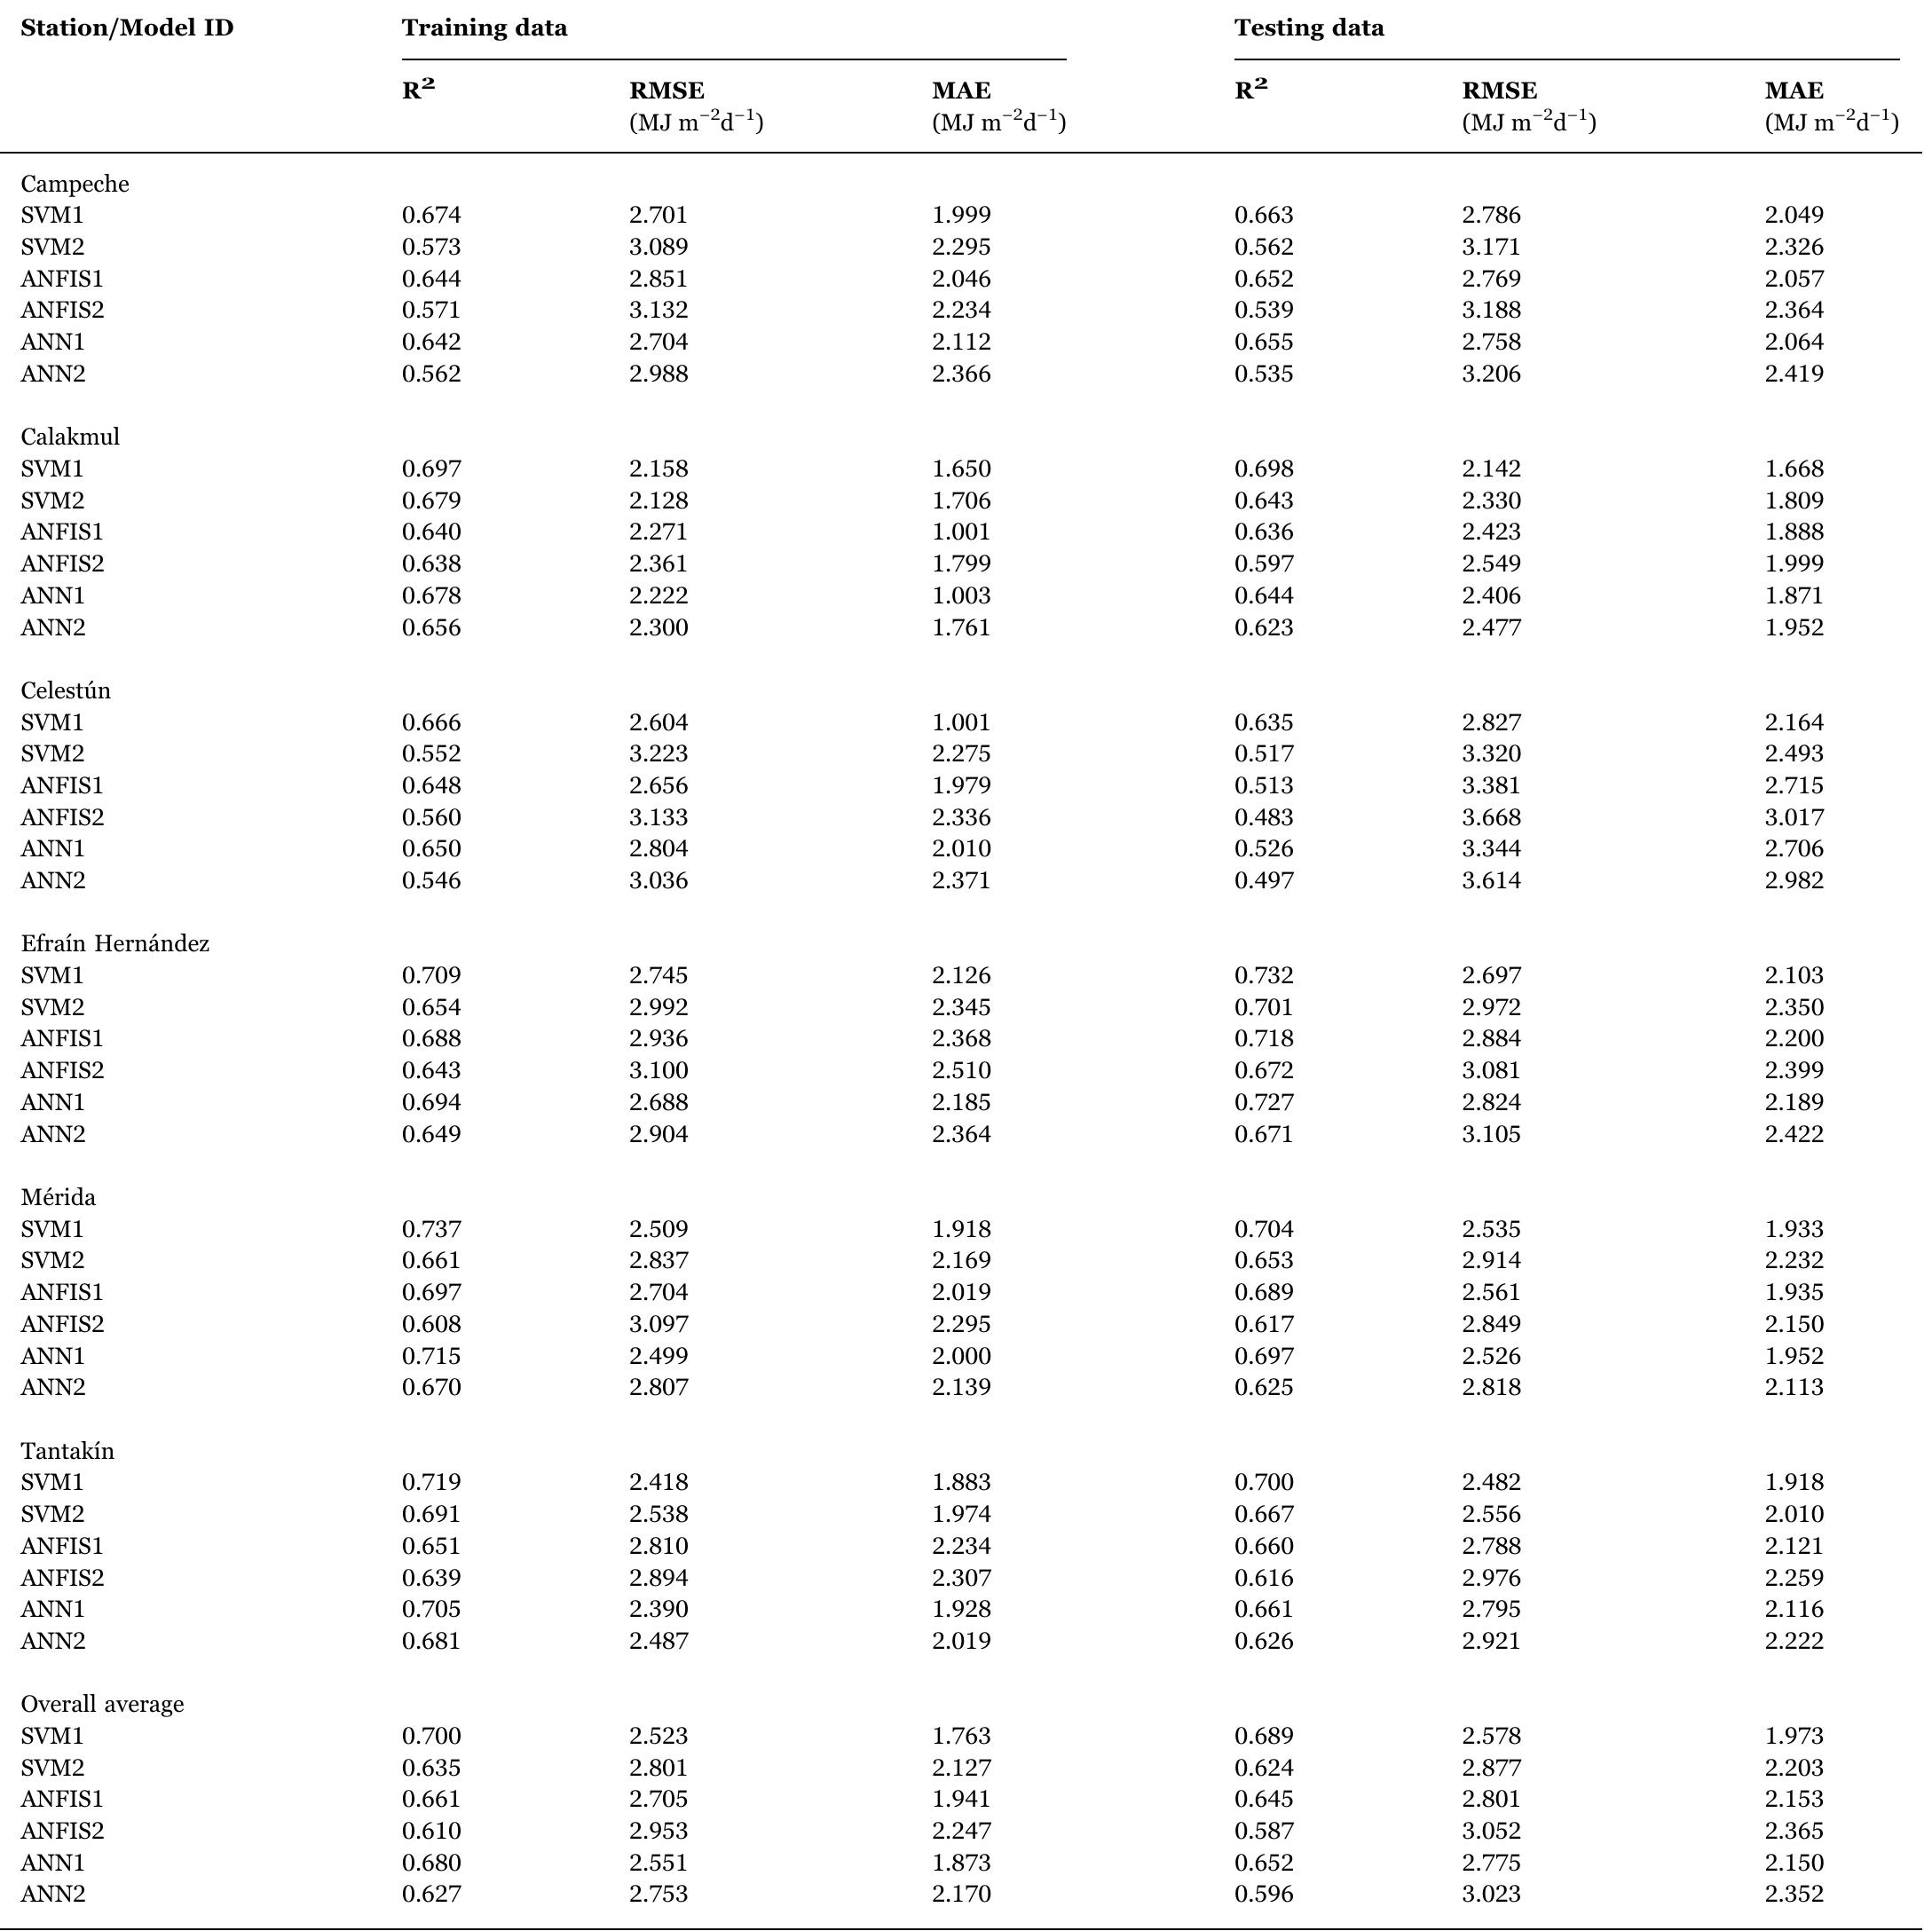
Geographic information of the study weather stations. Table 1 Fig. 1. A three-layer artificial neural network structure. The basic MF's used in the study. {a, b, c, d} is the parameter set that changes the shapes of the MFs with maximum 1 and minimum 0. Table 2 where x and y are the crisp inputs to node i, A; and B; are the fuzzy sets in the antecedent, f; is the output within the fuzzy region specified by the fuzzy rule; and p;, gq; and r; are the design parameters that are determined during the training process. Features of the ANN models. Table 4 Optimum SVM parameters obtained by the GA-based. Table 5 The R*, RMSE and MAE statistics for each model during training and testing phases for six locations in Yucatan, Peninsula, México. Table 6 Fig. 3. Regression analysis plot for the SVM1 model between measured and estimated values of daily global solar radiation during test phase.


