580 California St., Suite 400
San Francisco, CA, 94104

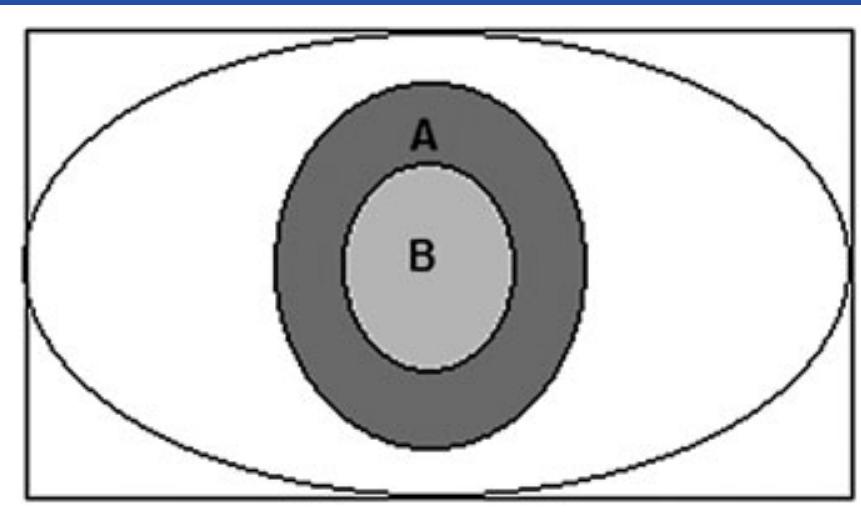
Figure 12 (a) Capable process when the PR is equal to the modified tolerance region. (b) Capable process with a correlation between quality characteristic In this section, similar to Pearn et al.7*, a confidence interval for the first component of the proposed index is developed, assuming the sensitivity parameter of the proposed PCI (A) is equal to zero. In Section 2.3, we discussed the sensitivity parameter and recommended the value of 0.27 for this parameter. However, as explained in the Section 2.3, when the correlation between quality characteristics