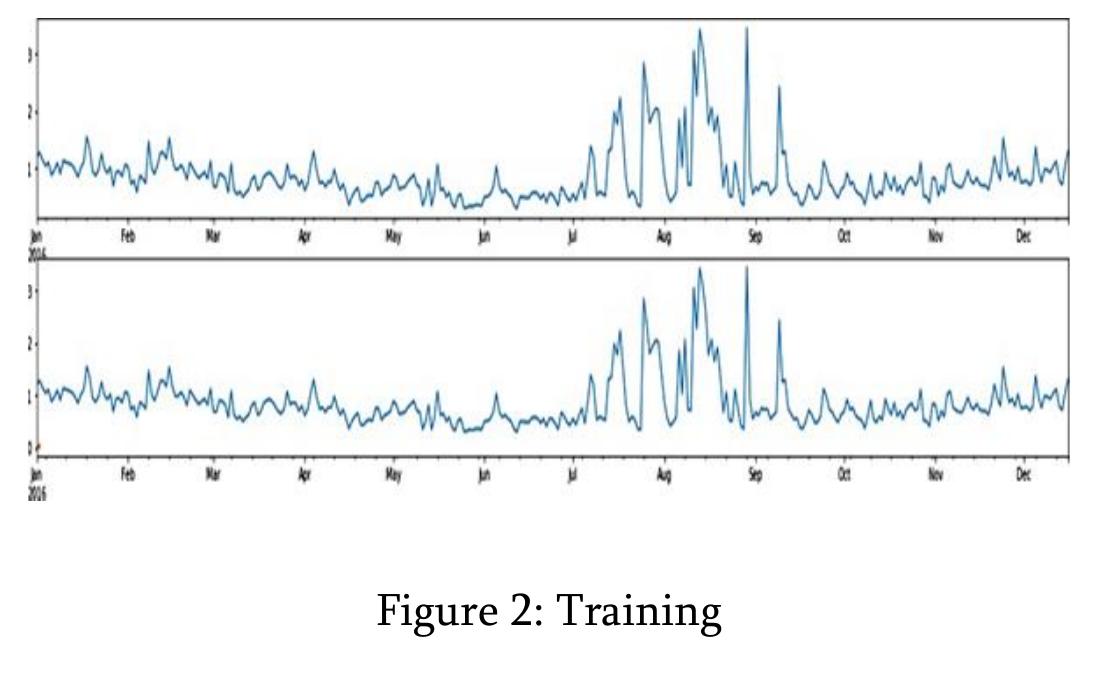
Figure 2 is presenting the training of the IOT devices. It consider from the month of jan to end of the dec. from the jan to dec. count with the month format. The month consider
Related Figures (11)
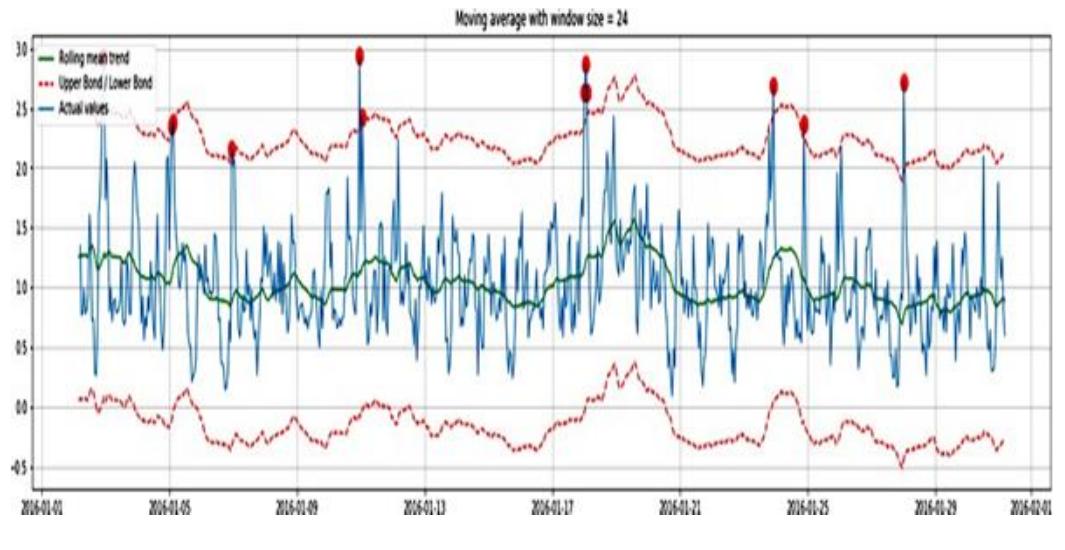
Steps- Figure is 4 is showing actual and the average value during the moving average window size 12. Table 1 : Simulation Results Figure is 7 is showing predicted and actual data from the given dataset. It is clear from the result graph; the Figure is 9 is showing energy prediction. The original and predicted energy is shown in the graphical form. Figure 5.26 : Accuracy Result graph achieved by the proposed work is 94.25 % while previous it is achieved 92.8 %. The error rate of proposed technique is 4.37 % while 8.2 % in existing work. Therefore it is clear from the simulation results; the proposed work is achieved significant better results thanexisting work.


