Table 5 Mann-Kendall (M—K) trend analysis (T) and Sen’s slopes (Q) of the water quality parameters in the stations of the Mataquito basin. *Significant p < 0.05, **Significant p < 0.01.
Related Figures (14)
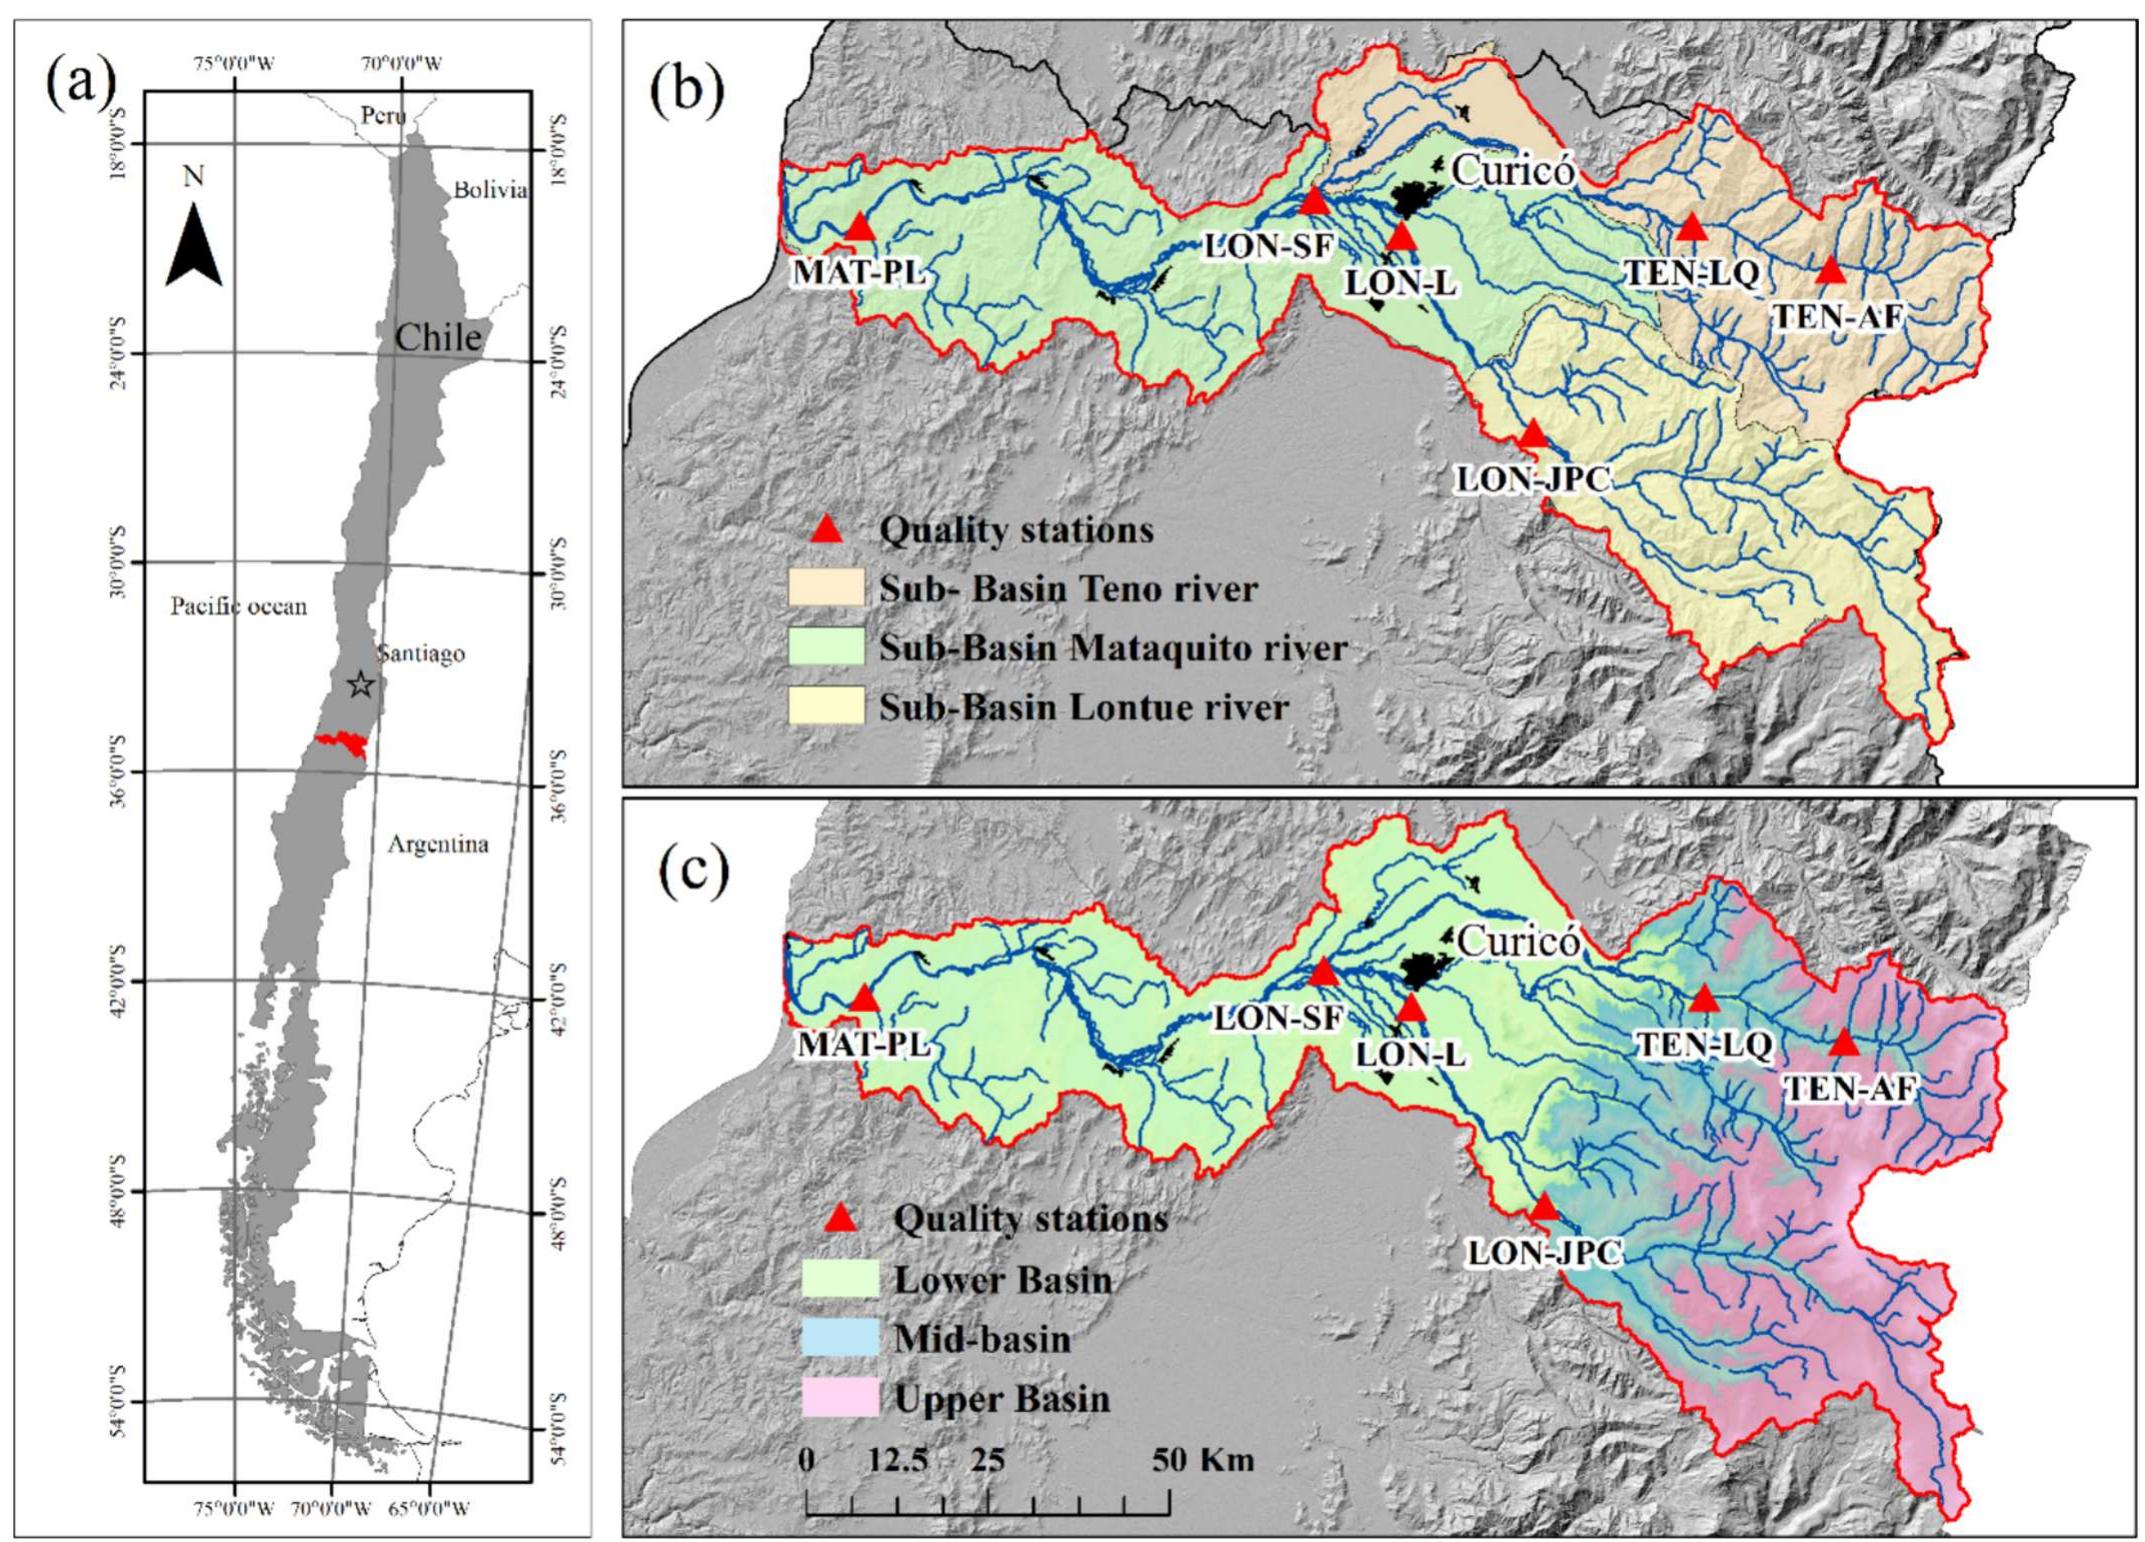
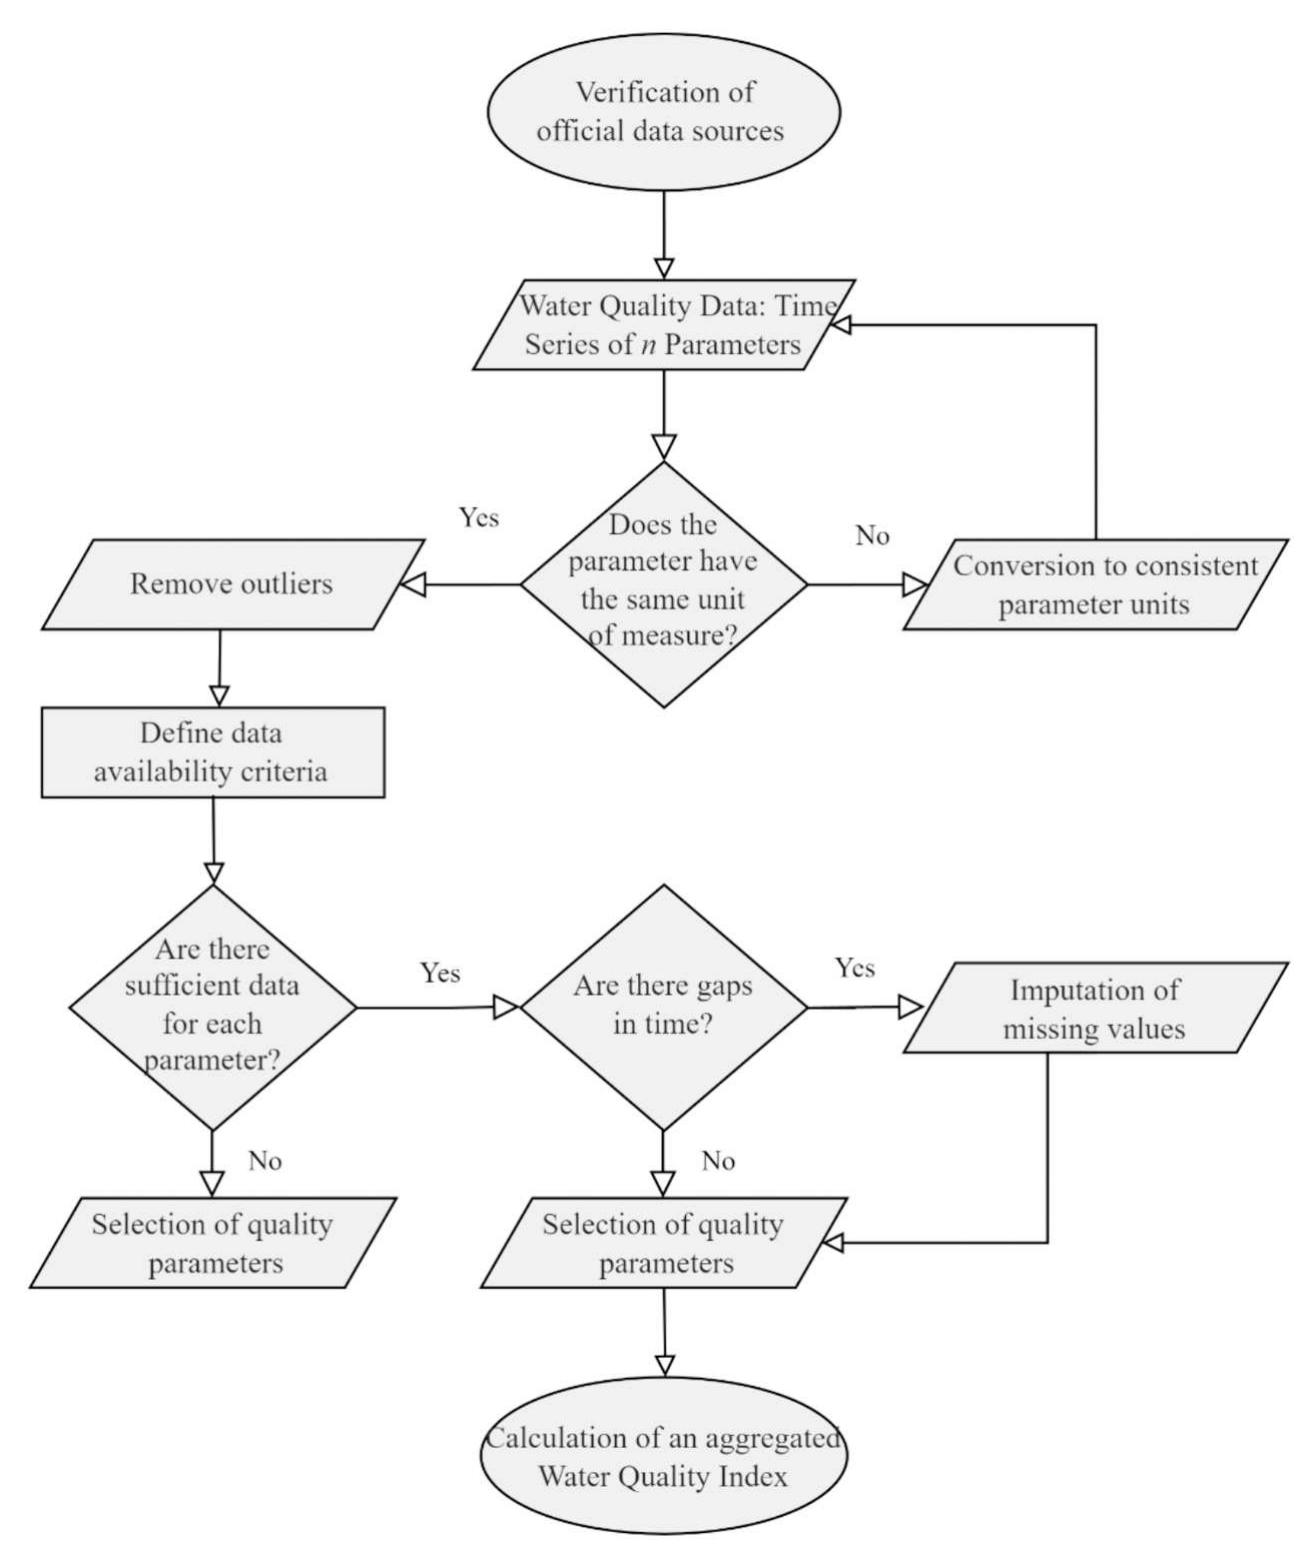
Fig. 1. Study area. (a) Geographic location of the Mataquito River basin in Central Chile. (b) Sub-basins and tributaries of the Mataquito River and water quality measurement stations. (c) Distribution of the water quality stations according to the lower, middle, and upper zones of the Mataquito River basin. One of the challenges in environmental assessment within the earth et al., 2021). In this sense, water quality is one of the dimensions rele vant for achieving water security (Mishra et al., 2021; Norman et al. 2013; Tundisi et al., 2015). High levels of water abstraction can have | negative impact on water quality, as well as significant agricultura activity, population growth, urban activities, and climate chang (Grafton et al., 2013; Lawniczak-Malinska et al., 2023; Liyanage an Yamada, 2017; Patil et al., 2022). In central Chile, the most populate area, climate change and overconsumption in agricultural productio: are expected to lead to decreases in flow (Jodar et al., 2024; Muno et al., 2020). To ensure the long-term sustainability of water resources, i is crucial to implement effective monitoring systems for water man agement with a focus on assessing water quality over time and acros different spatial areas. In line with this, water quality parameters and | water quality index (WQI can assist in trend monitoring, publi reporting, scientific research, and decision-making (Abbasi and Abbas: 2012; Banda and Kumarasamy, 2020; Chidiac et al., 2023; Fortes et al 2023; Rana and Ganguly, 2020; Uddin et al., 2021). A quality inde provides a comprehensive view of the spatio-temporal variation in wate quality in a basin. It is a versatile indicator for specific water uses, sucl as human consumption and irrigation, and for applications, such as th health status of limnological ecosystems (Akter et al., 2016; Alsubil et al., 2022; Lee et al., 2022; Mukate et al., 2019; Osta et al., 2022 Viveka et al., 2021; Zhang et al., 2019). A single WQI value scale fa cilitates comparisons between different sampling sites and allows fo easier and quicker comprehension of information than a long list o ‘i a a: Basic information of water quality stations in Mataquito River Basin. Table 1 Fig. 2. Flow chart for the process of cleaning and analysis of water quality data up to the calculation of the WQI index. The process of constructing a WQI involves various stages, such as where n represents the total number of parameters, C; is the value hensive measure of water quality, incorporating various physical, chemical, and biological parameters into a single dimensionless value (Abbasi and Abbasi, 2012; Banda and Kumarasamy, 2020, Chidiac et al., 2023; Fortes et al., 2023). This index is useful for categorizing water quality into different categories, such as poor, good, or excellent, and it can be employed to represent variations in water quality, typically ranging from 0 to 100, over both space and time within a watershed (Uddin et al., 2021). Therefore, a decrease in water quality can have significant implications for water use, making the WQI a crucial tool for water quality assessment and community involvement (Akter et al., 2016; Mukate et al., 2019; Osta et al., 2022). Fig. 3. Pearson correlation matrix between water quality parameters calcu- lated at the stations in the Mataquito River basin. ns p > = 0.05; * p < 0.05; ** p < 0.01; *** p < 0.001. Principal components matrix derived from PCA with data on water quality pa- rameters in the Mataquito River basin. Fig. 5. Spatial cluster analysis based on Euclidean similarity measure using water quality parameters from the stations in the Mataquito River basin. Fig. 4. Principal Component Analysis (PCA) of water quality parameters across the quality stations in the Mataquito River basin. Descriptive statistics of the Water Quality Index (WQI) calculated for the stations in the Mataquito River basin. 4. Discussion Table 4 Fig. 6. (a) WQI grouped by decades (1) 1980-1989, (2) 1990-1999, (3) 2000-2009, (4) 2010-2019 at the water quality stations of the Mataquito River basin. (b) WQI grouped by season of the annual cycle of summer, fall, winter, and spring at the water quality stations of the Mataquito River basin.


