580 California St., Suite 400
San Francisco, CA, 94104

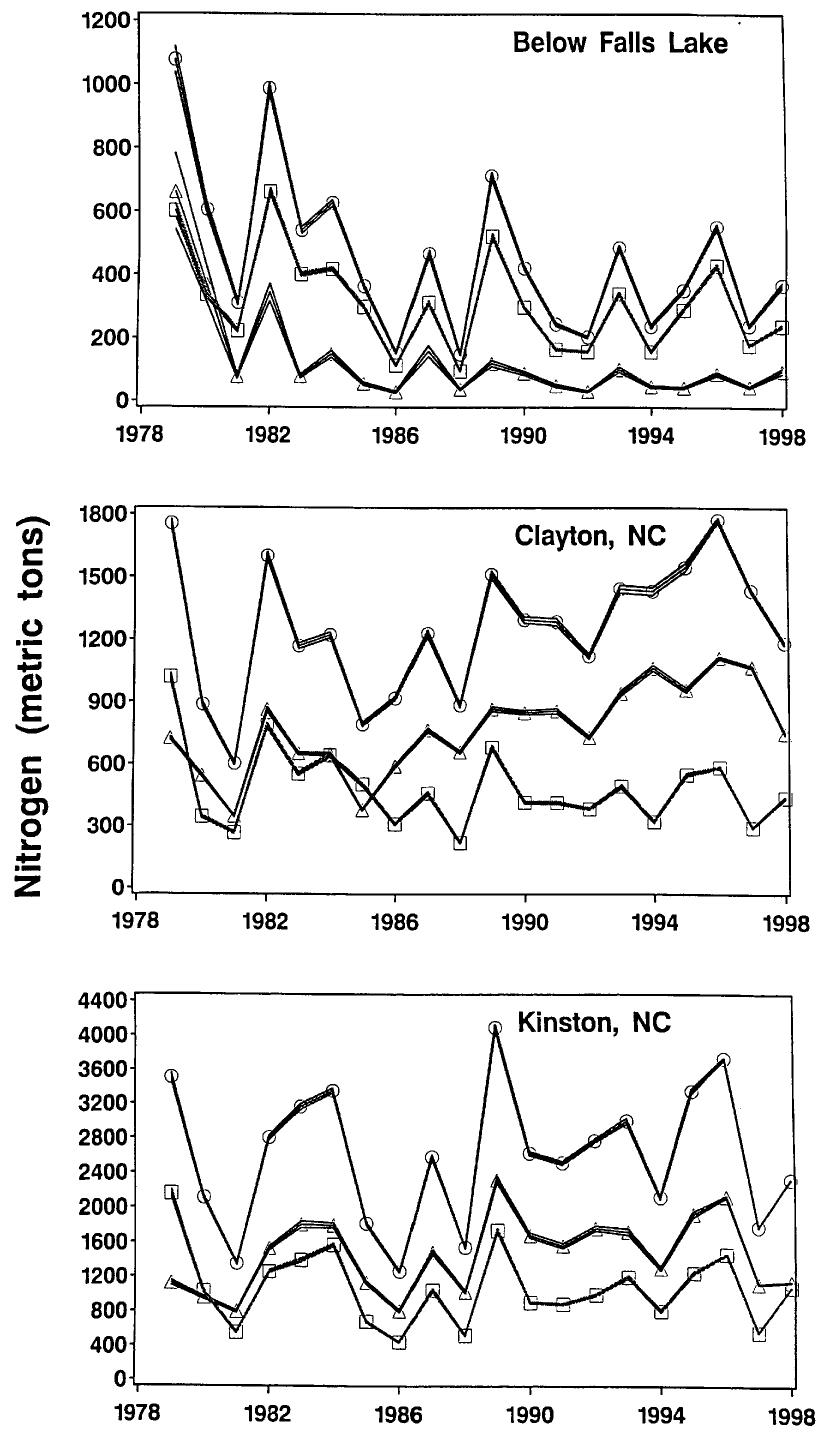
Figure 12 Time required to detect reductions in total nitrogen load at Kinston for p-values of 0.1 (bottom), 0.05 (middle), and 0.01 (top). (The Bayesian analogue would be posterior Bayes factors of 54 and respectively.) 24 ree ies Fig. 11. Median concentration from 1988 to 1997 divided by median concentration from 1979 to 1987, for each of the seven monitoring stations depicted in Fig. 1. Circles indicate the Falls Lake (station 1), Clayton (station 2), and Kinston (station 5) stations.