


580 California St., Suite 400
San Francisco, CA, 94104
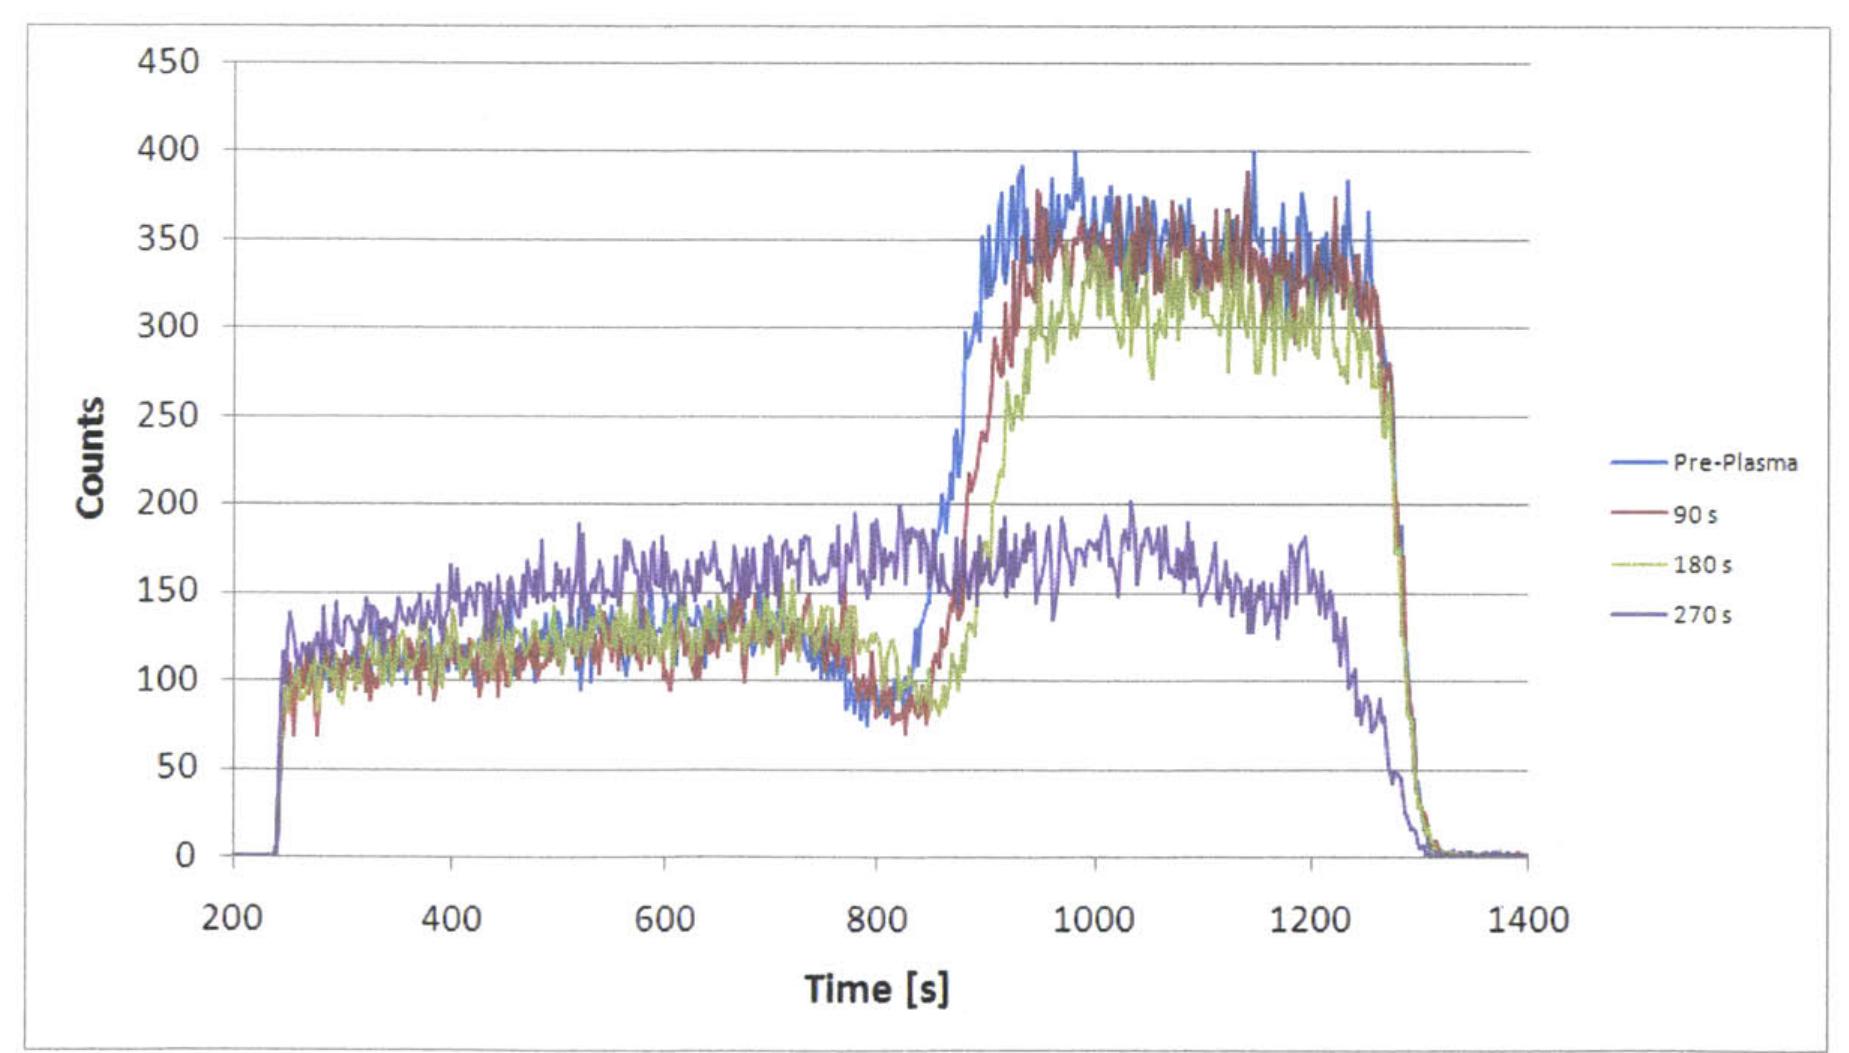
Figure 6 11. Present in fig. 6-14 are sample RBS spectra collected from target 18. Figure 6-14: Sample energy spectra taken from target 18 during exposure at 90 second intervals and a target bias of -32 V why the copper signal disappeared even quicker than the -35 V experiment with target target temperature even prior to plasma bombardment. This would help to explain


