580 California St., Suite 400
San Francisco, CA, 94104
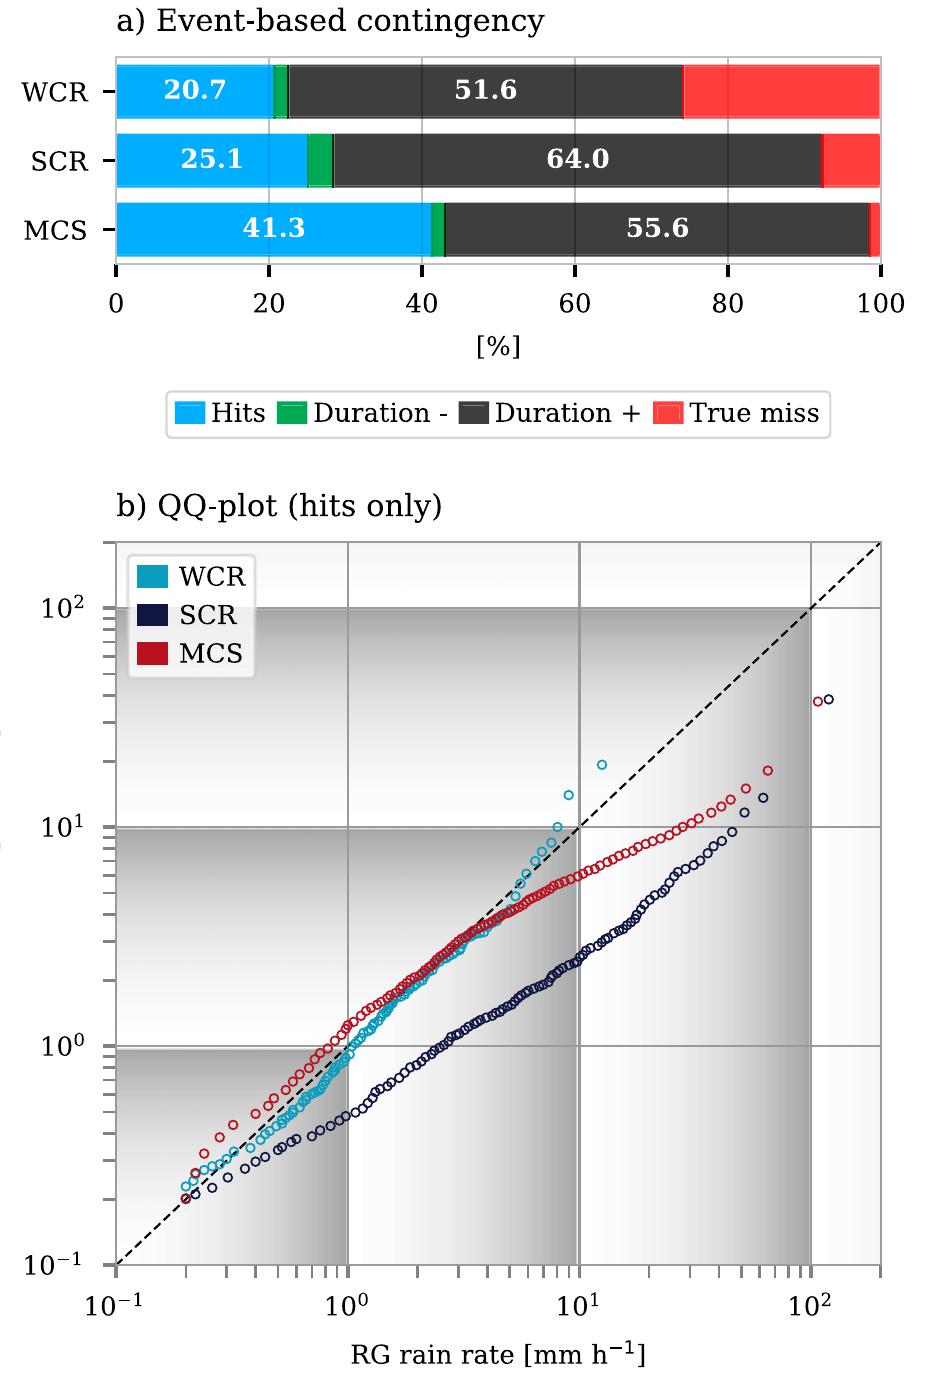
Figure 7 (a) Fractional distribution of the event-based contingency table for WCRs, SCRs, and MCSs. True false alarms are excluded since only time steps associated with rainfall types are considered. (b) Q-Q plots of rain rates for time steps with hits for WCRs, SCRs, and MCSs.