Table 3 * denotes a statistically significant difference with 95% confidence level * denotes a statistically significant difference with 99% confidence level
Related Figures (8)
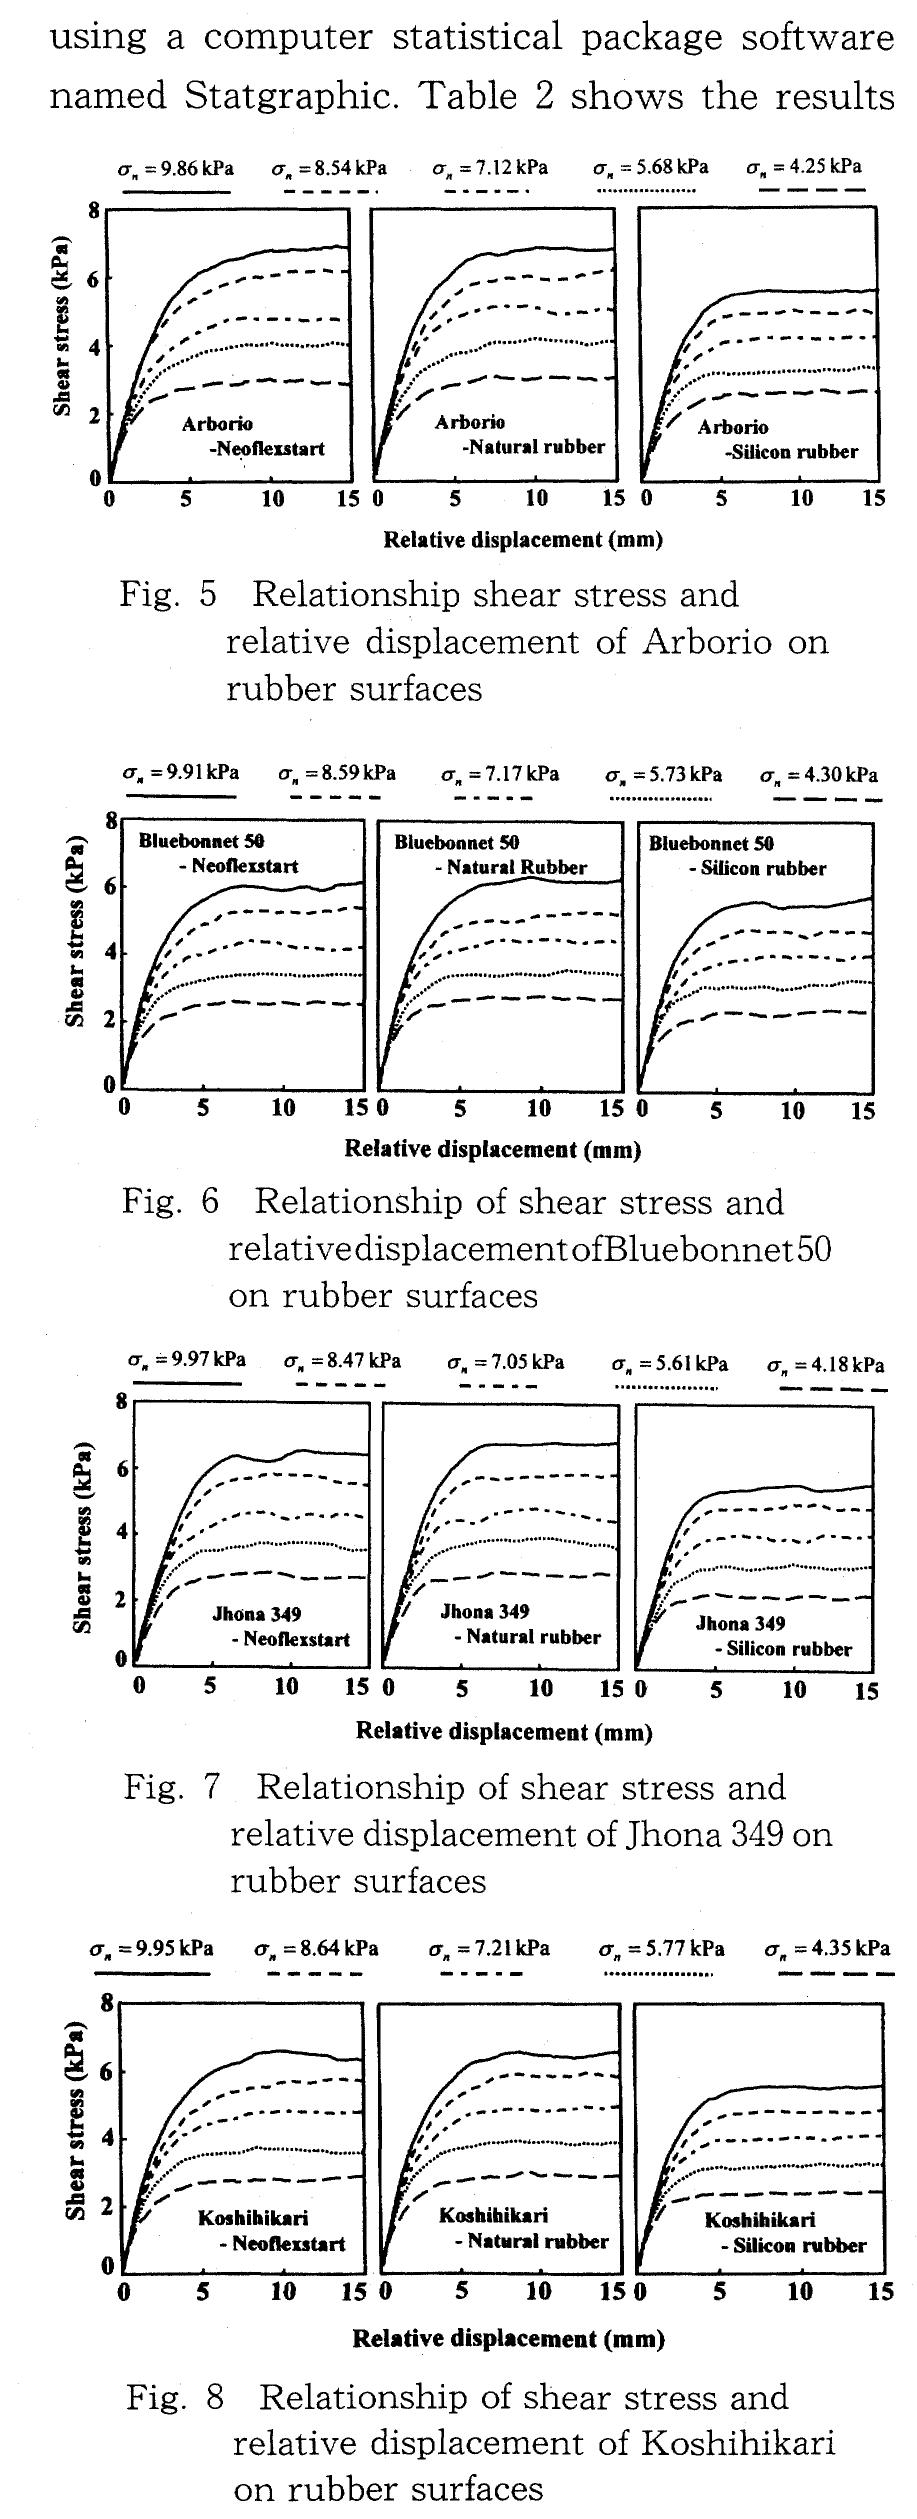
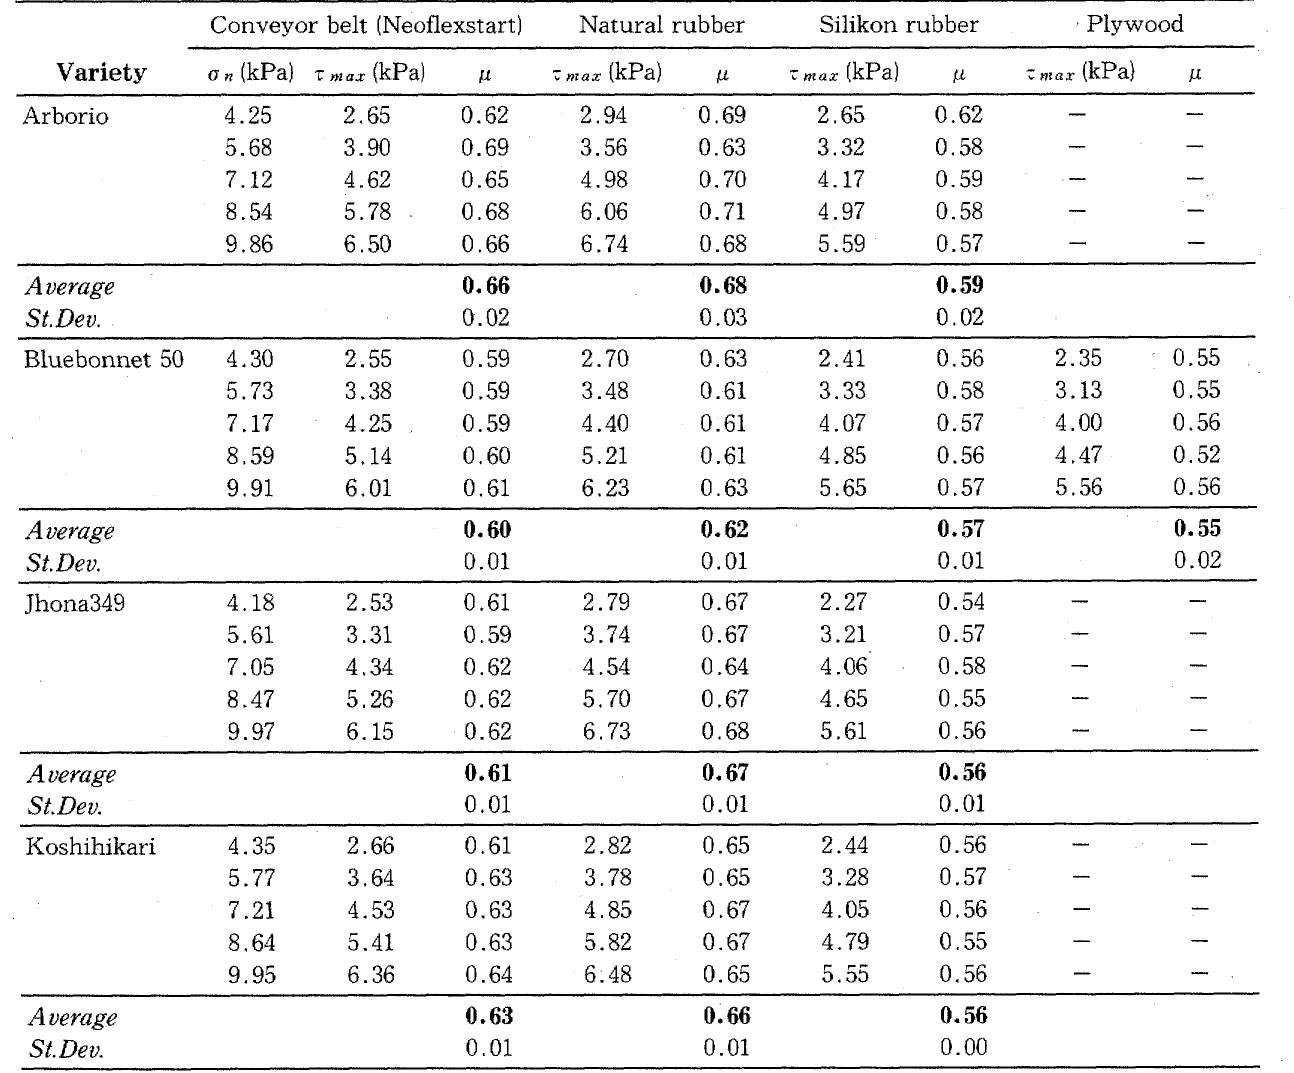
Fig. 1 Shapes of rice grain samples and shape of the grain of each variety were Three rubber materials were used as surface Co. Ltd.; Neoflexstart-V; NS41VN5/5G), a natu- The horizontal friction force is measured using box in this experiment was made from 10mm Fig. 4 Shear stress-relative displacement curve Table 1 The coefficient of friction between rice grains and several rubber surfaces Table 2 The difference between yu among rice varieties and each rubber surface *« denotes a statistically significant difference with 99% confidence level experiment. Nf : Neoflexstart-V Conveyor belt NR: Natural rubber SR : Silicon Rubber ble 3 The difference between p» among rubber surface and each rice variety about 48 hours to determine dry mass. Both


