580 California St., Suite 400
San Francisco, CA, 94104

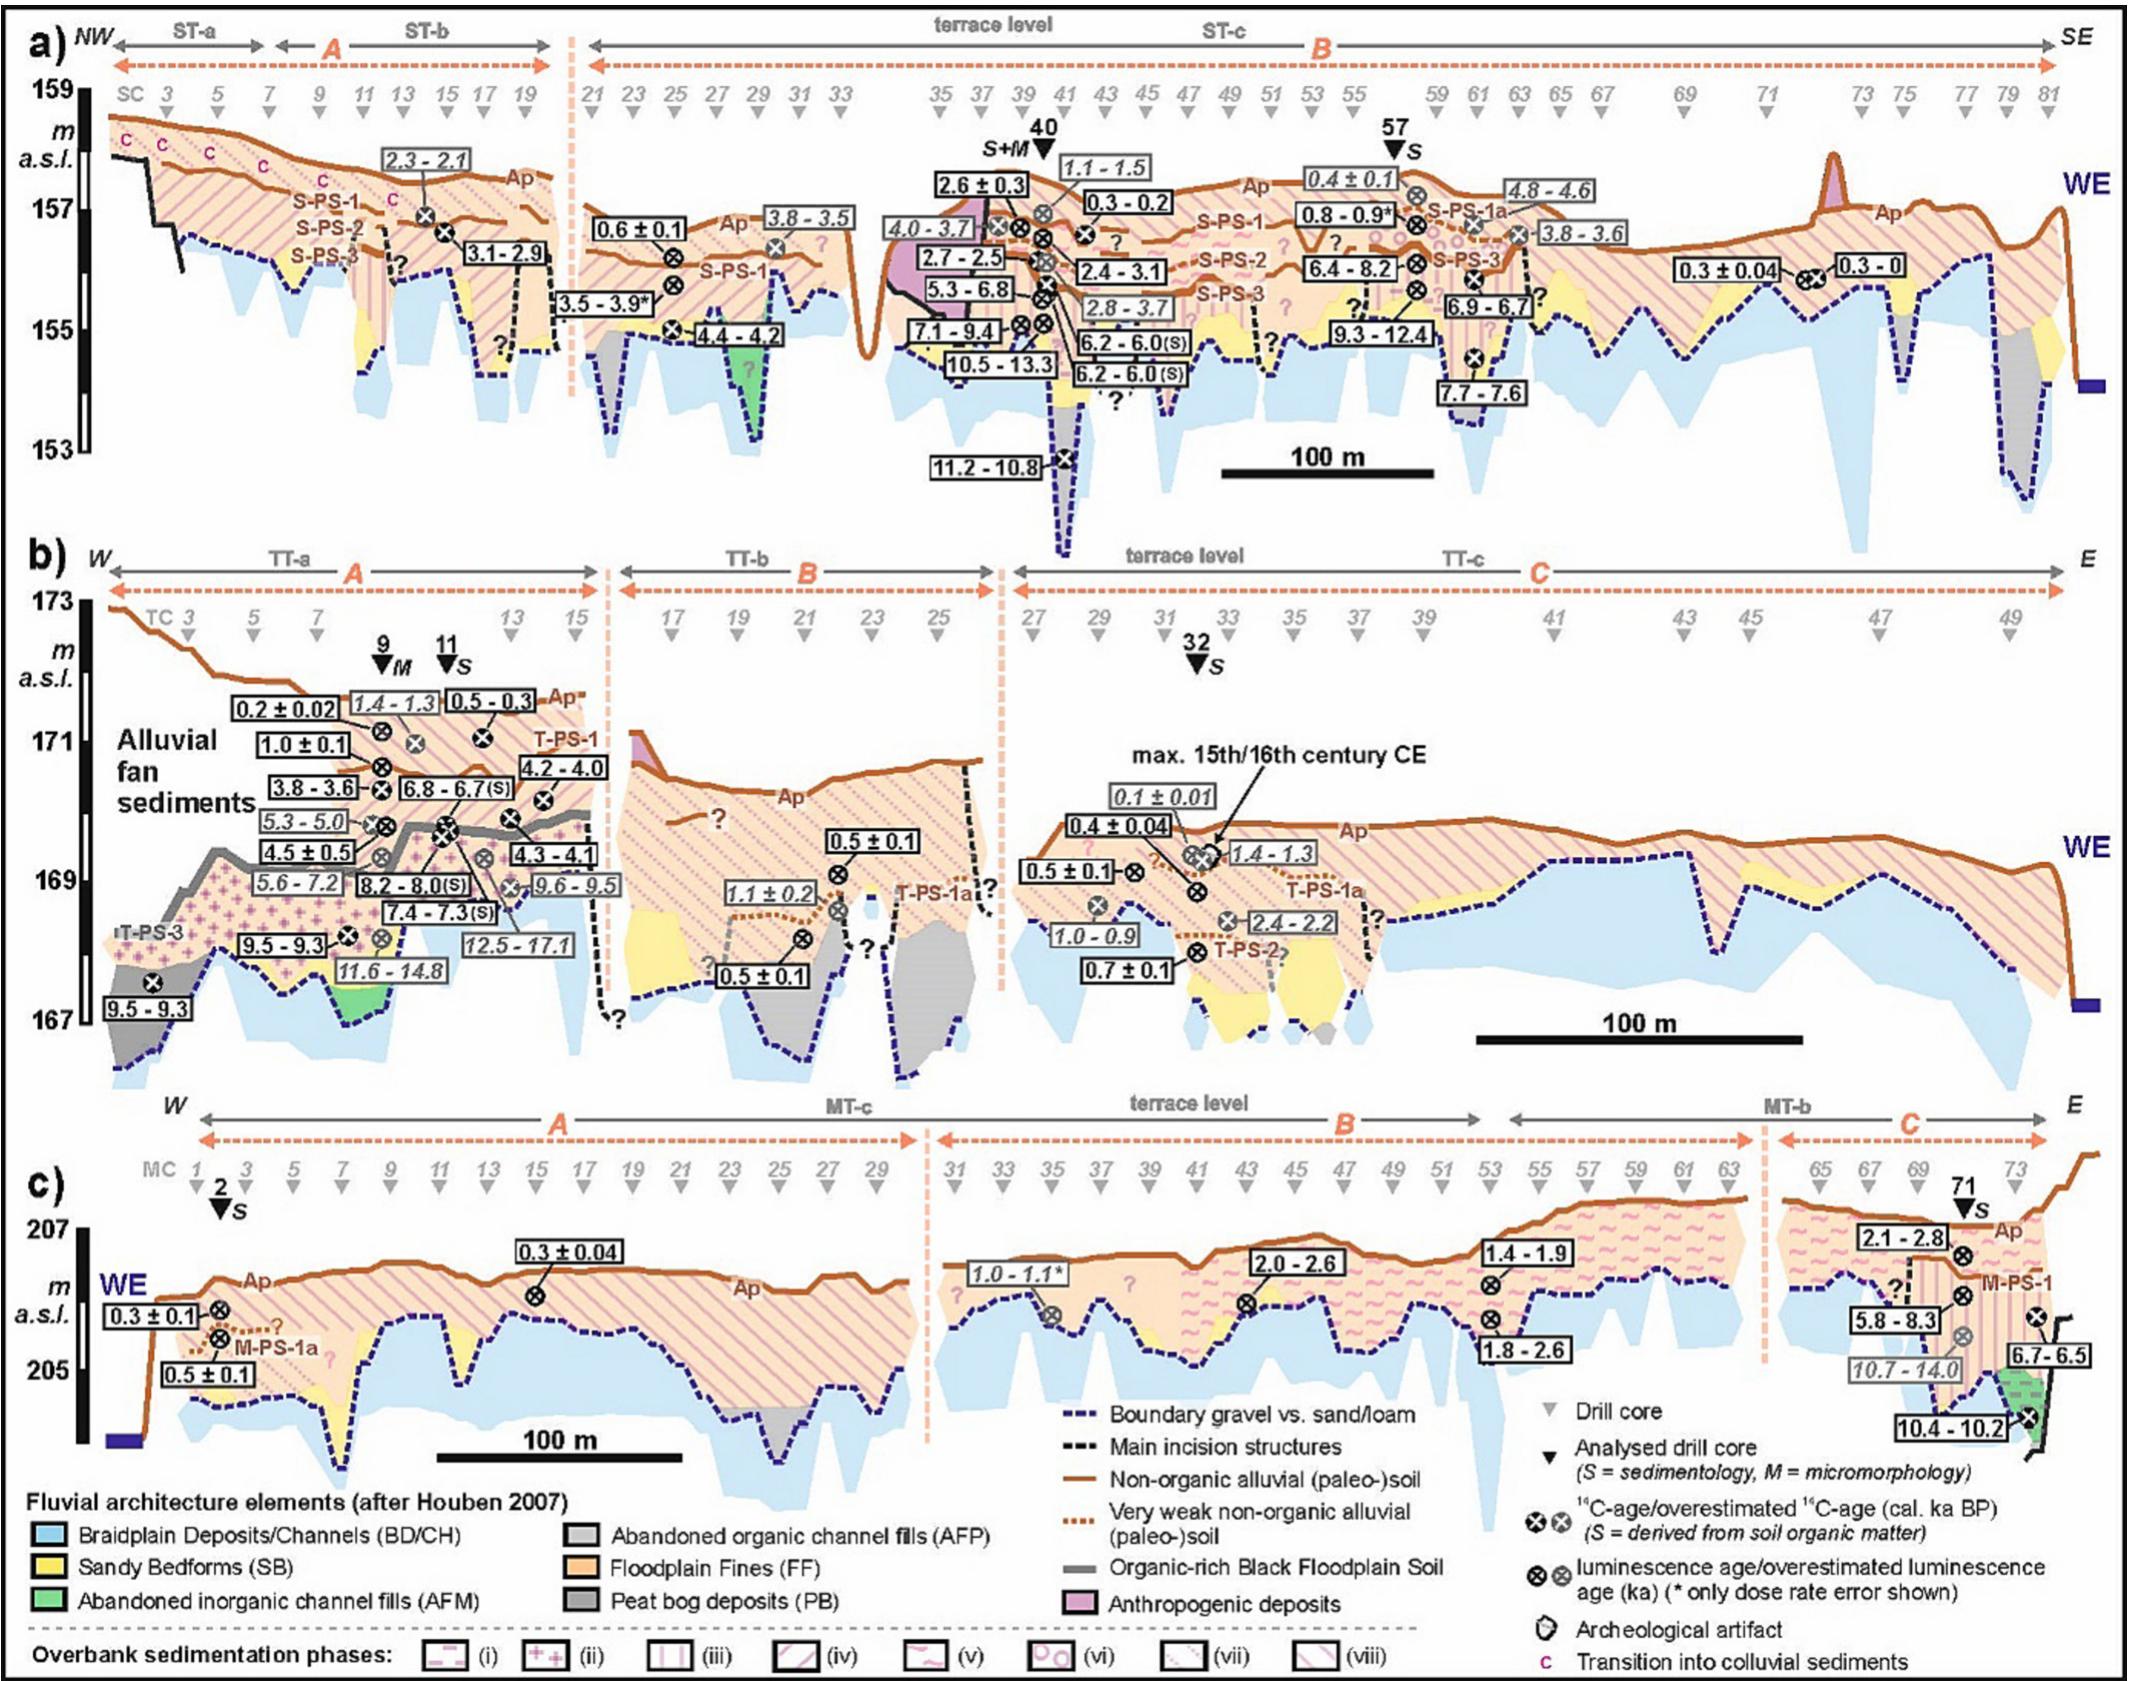
Figure 4 Profile drawings of the six analyzed cores with overbank sedimentation phases and analytical values with interpretations from Salsitz (a, b), Trebnitz (c, d and Meilitz (e, f). Furthermore, numerical ages from these cores probably representing sedimentation ages are shown.