


580 California St., Suite 400
San Francisco, CA, 94104
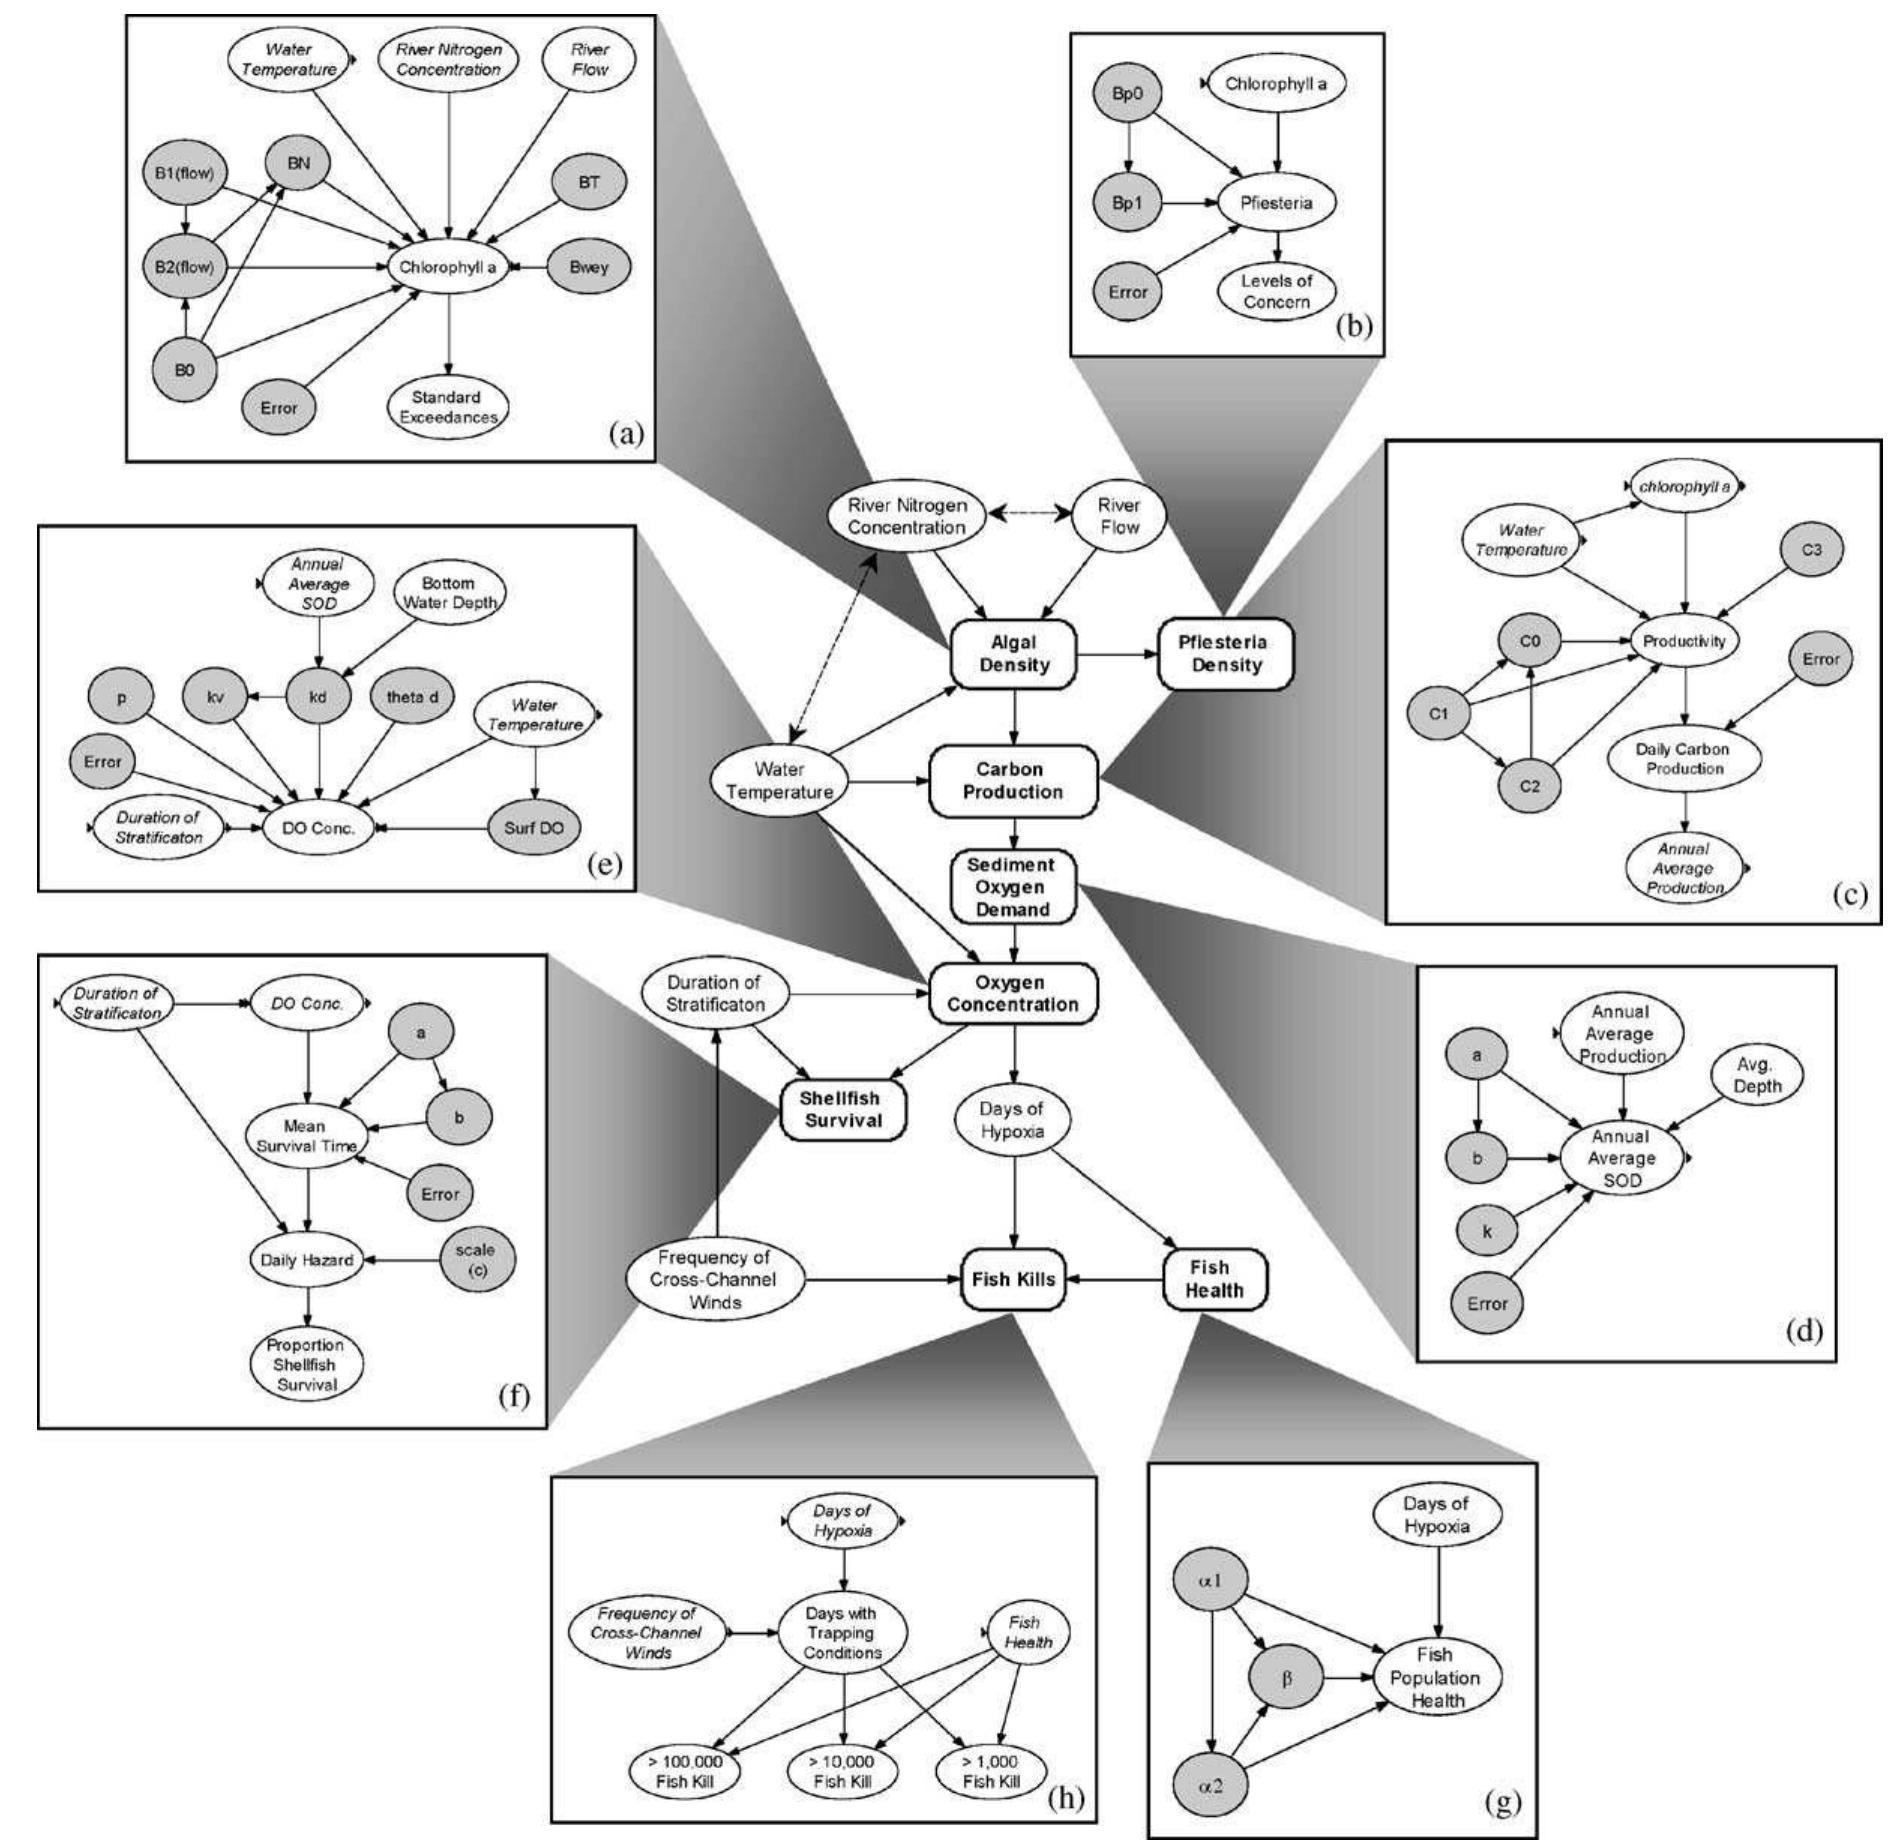
Figure 2 Centre figure: graphical representation of the full Bayesian network for Neuse estuary eutrophication. Variables are indicated with rounded nodes, and causal relationships are indicated with arrows. Surrounding insets: networks representing submodels of the main network. Shaded nodes indicate model parameters. Double-headed, dashed arrows indicate a correlation between marginal variables that may be the result of exogenous factors, rather than causal influence.


