580 California St., Suite 400
San Francisco, CA, 94104

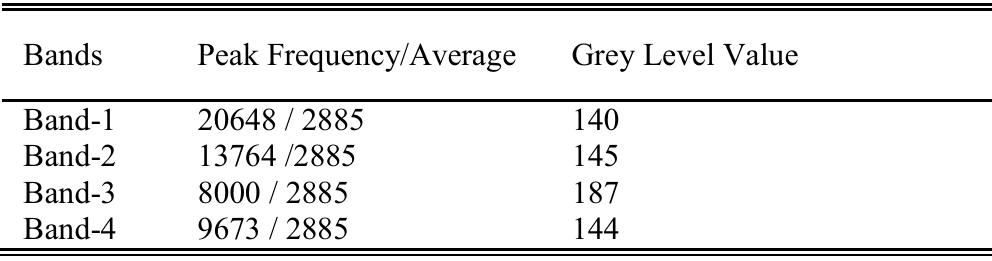
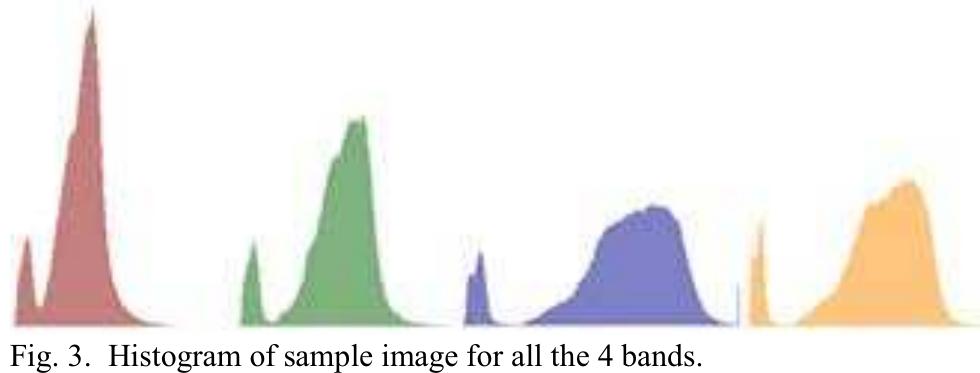
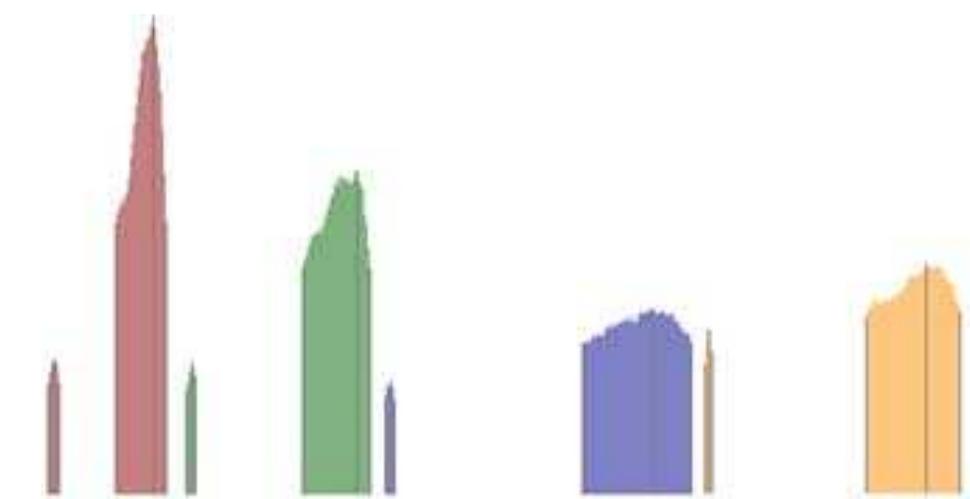
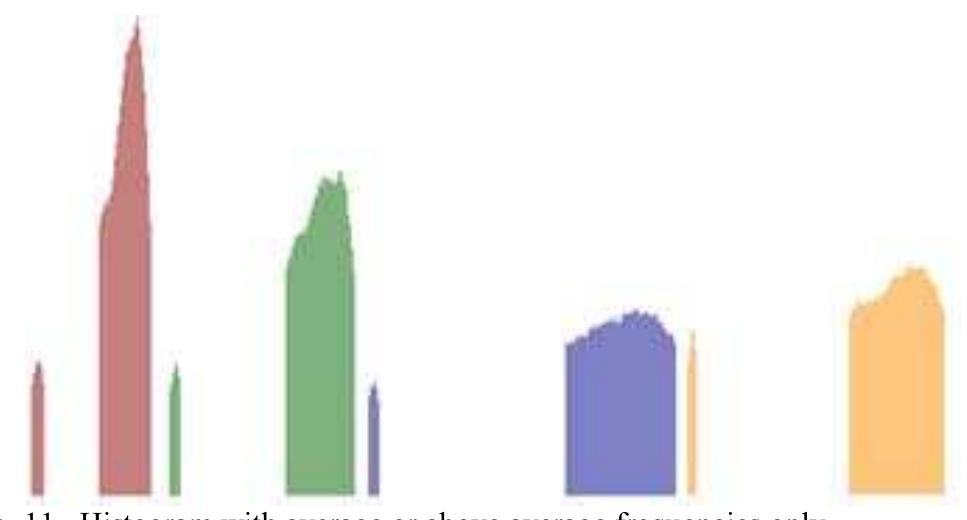
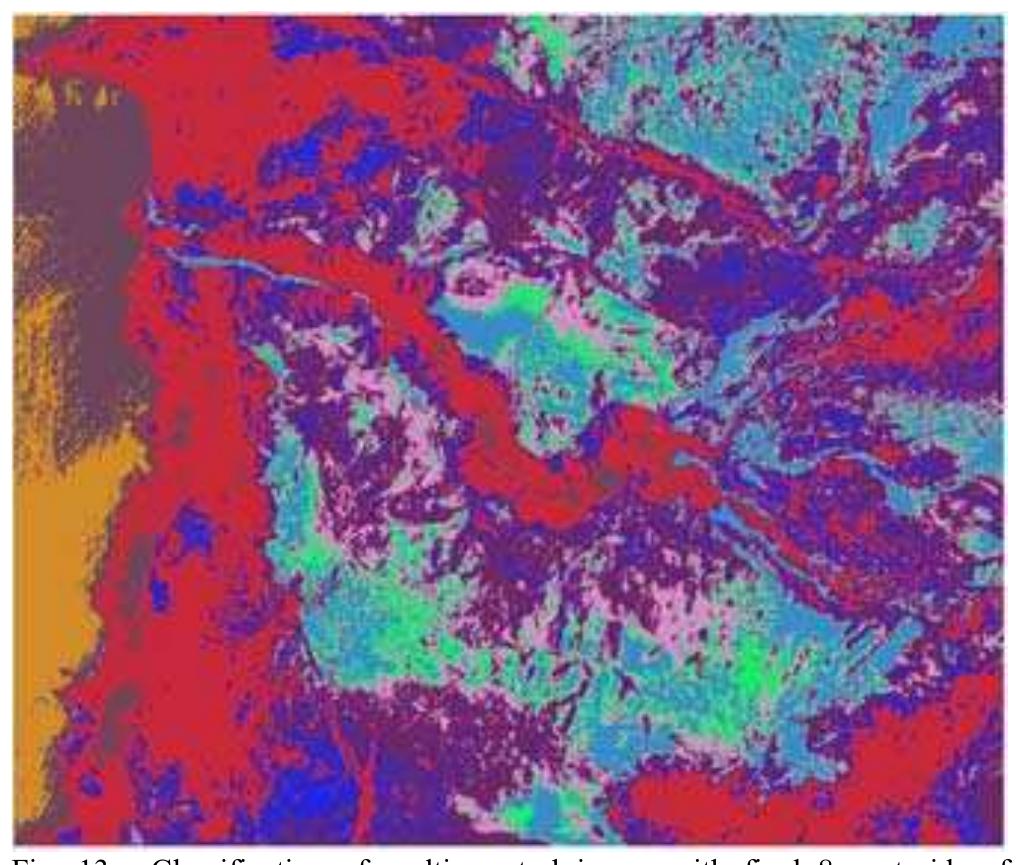
Figure 2 Process flow diagram for classifying the image using humps of histogram. Fig. 1. Sample four single band images of different spectral bands. This sample image is used for classification in this paper.