580 California St., Suite 400
San Francisco, CA, 94104

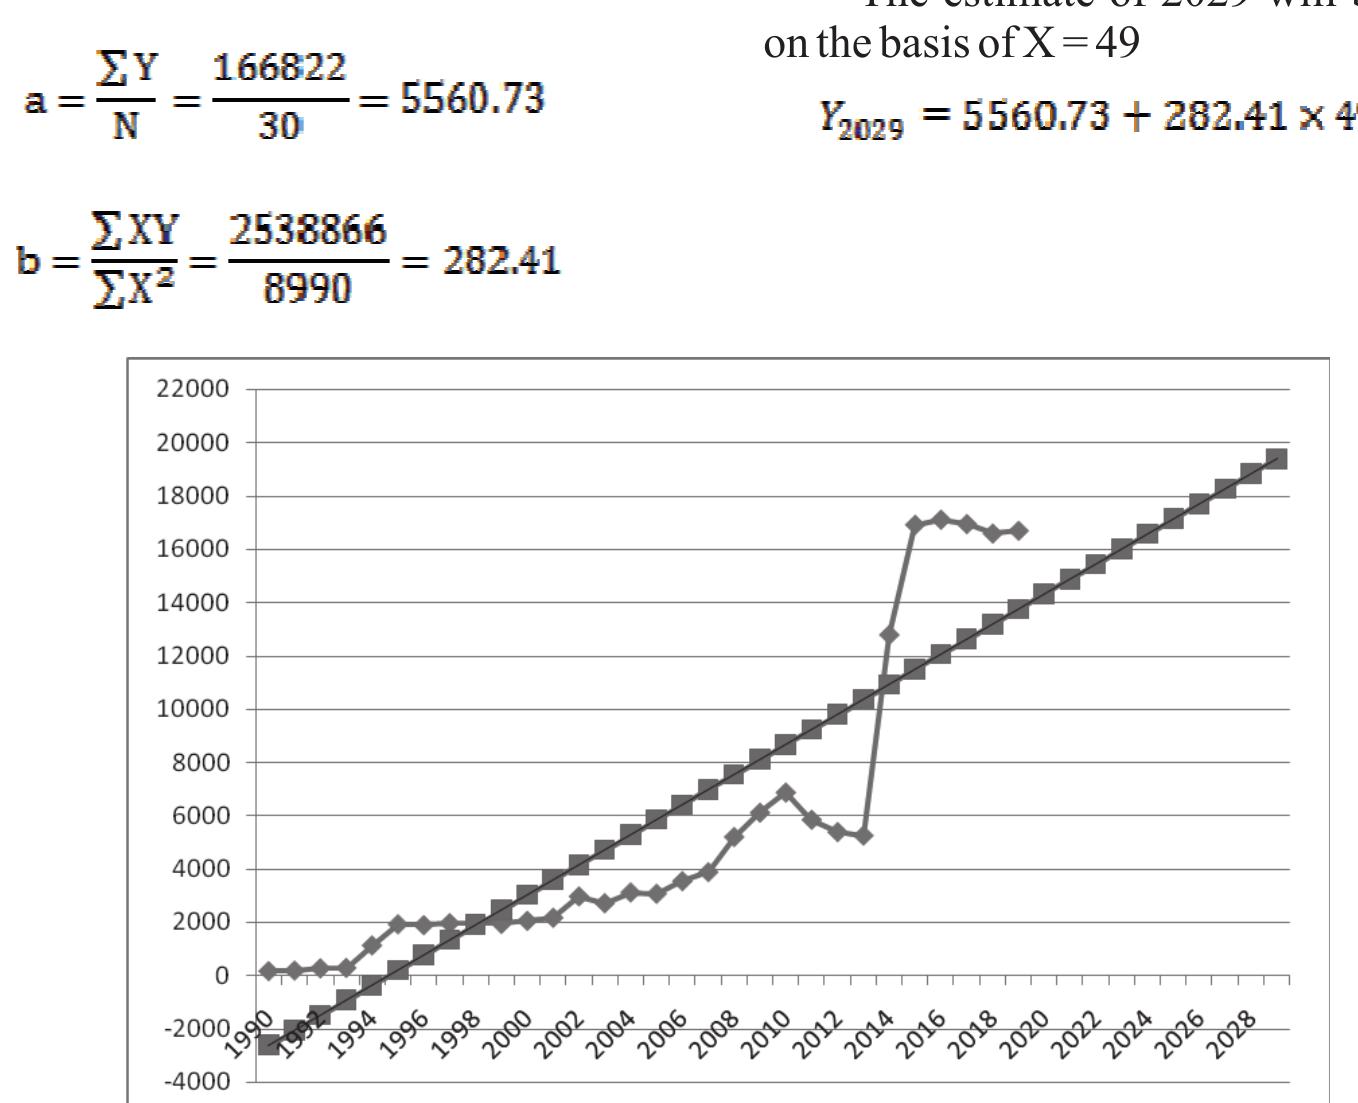
Table 1 Year-wise distribution of number of Indian publications in Virology growth rate was found to have dropped to 0.17 (2019) from 0.57 (1999), though the mean DT pattern follows reverse direction, which has increased to 4.45 (2019) from 2 (1999). Table | indicates the highest number of Indian virology publications was 562, published in 2019. The lowest number of publications, i.e., | was published in 1990. It has been observed that the mean relative