580 California St., Suite 400
San Francisco, CA, 94104
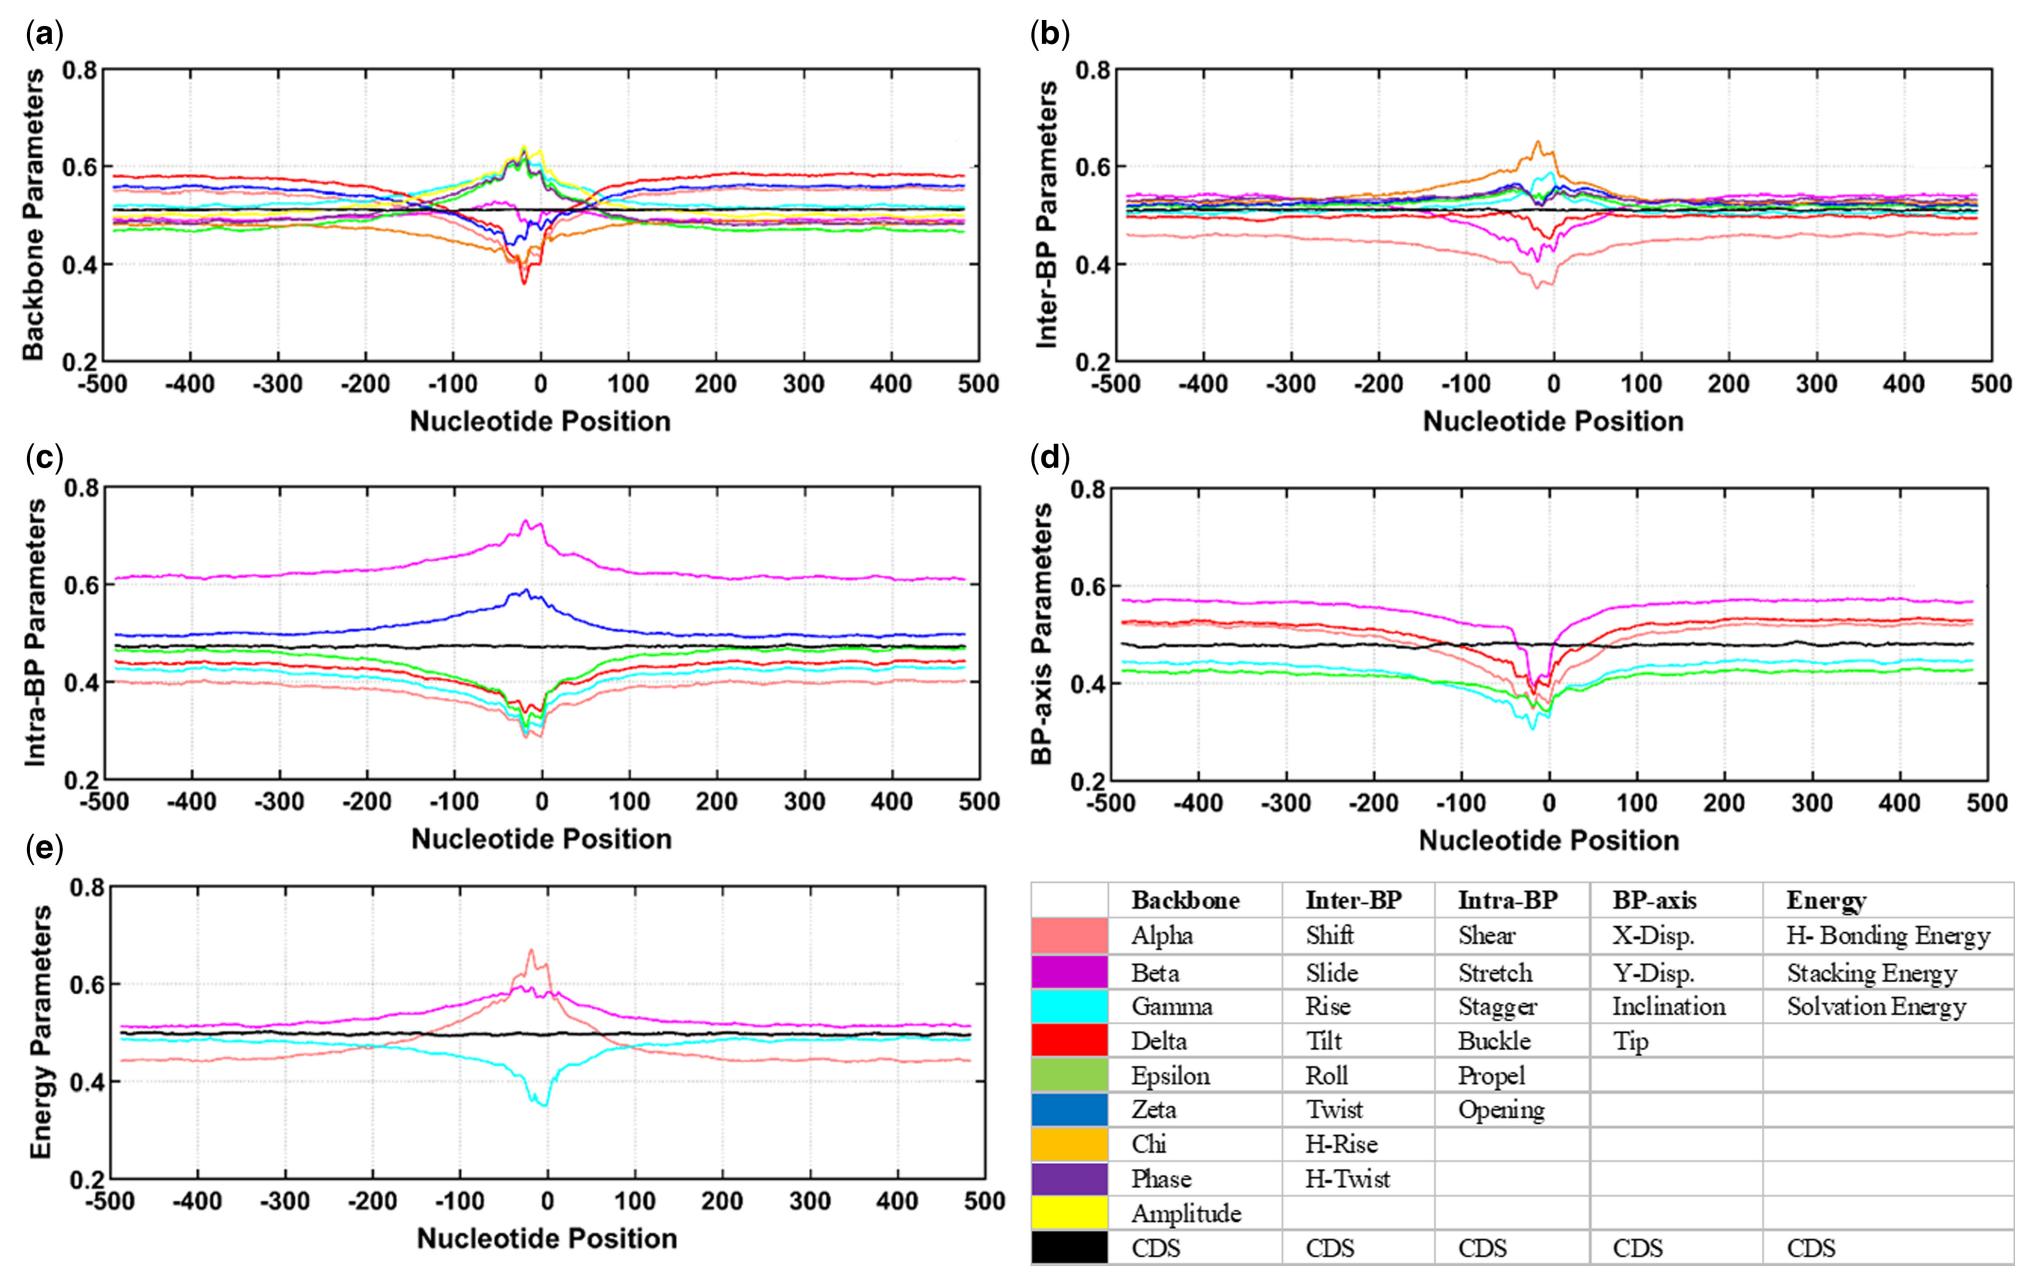
Figure 2 Normalized values of 31 structural and energy parameters of 1001-nt long sequences having primary promoters (coloured lines) as well as sequences with no promoters i.e. CDSs (black line). Parameters are shown in five graph based on their respective group. (a) Nine parameters of backbone, (b) eight inter-BP parameters, (c) six intra-BP parameters, (d) five BP-axis parameters and (e) three energy parameters. In each graph, each colour line plot represents specific parameter based on legend table, while line plot in black colour represents average of parameters shown in that group for coding sequence. (Color version of this figure is available at Bioinformatics online.)