580 California St., Suite 400
San Francisco, CA, 94104

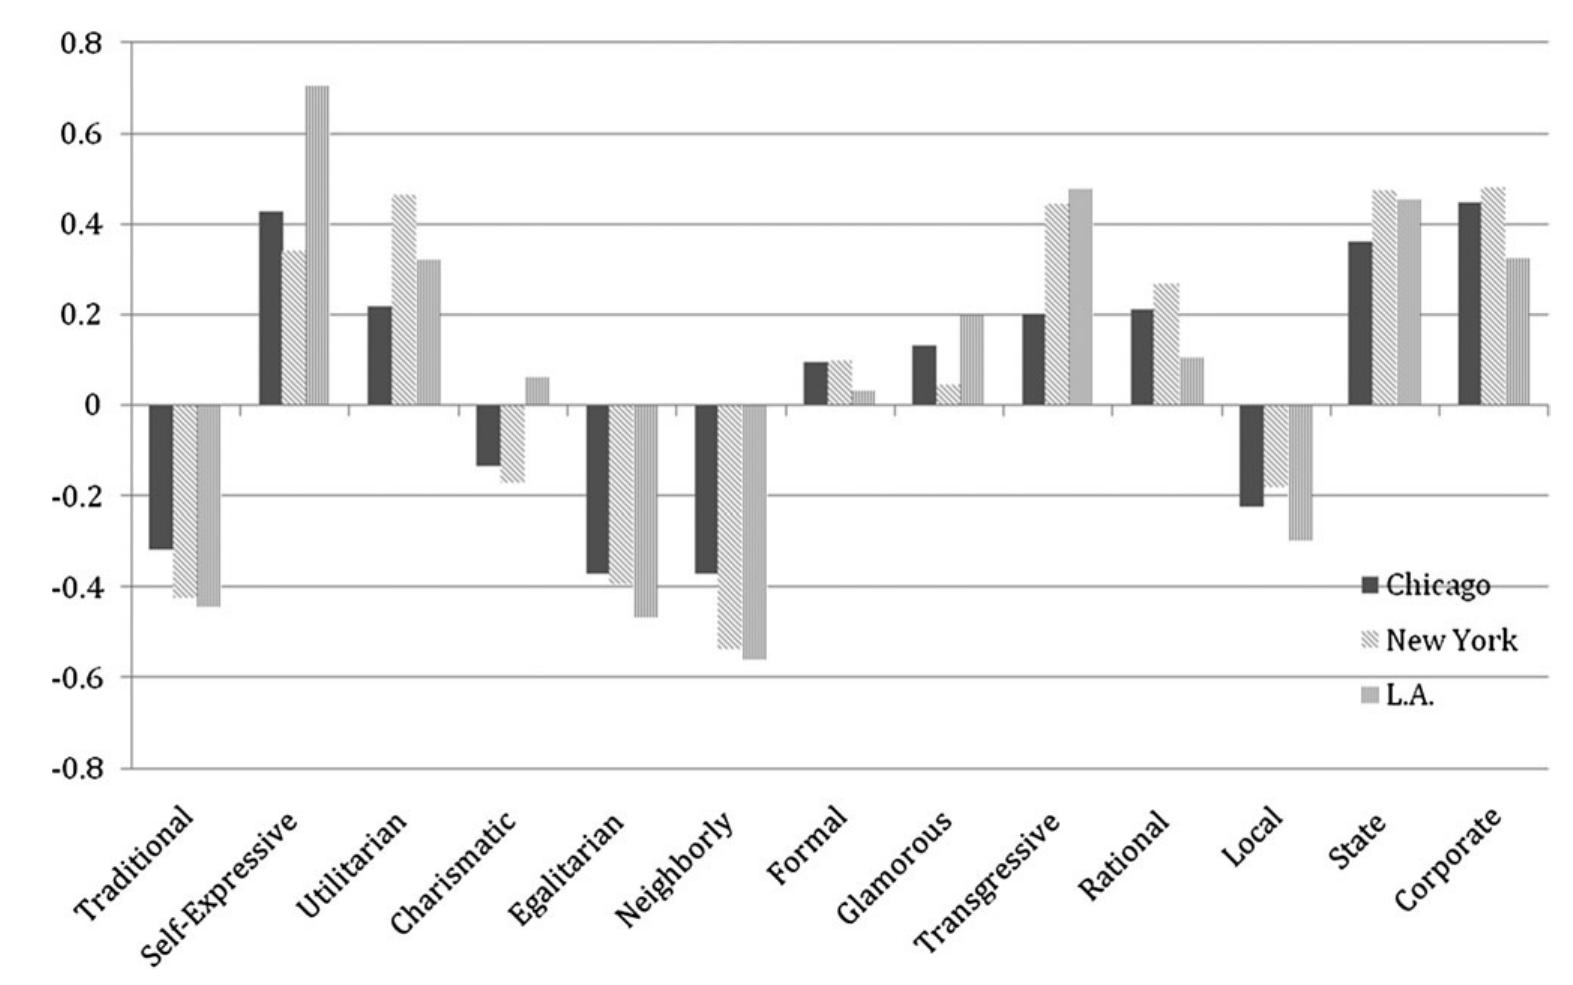
Figure 5 growin. Note: In Figures 5 and 6, bars show the impact via the standardized regression coefficients for scenes that promote self- expression on nine dependent variables (EntP etc.). Whiskers indicate the 95% confidence interval for each coefficient. Thus, if the whiskers do not cross (or touch) the horizontal line at zero, the results are statistically significant. From left to right, dependent variables are log entertainment patents per capita, log other patents per capita, log high-tech patents per capita, log proportional change in total employment (1994-2001), log proportional change in population (1990-2000), proportional change in per capita income (1990-2000), proportional change in gross rent (1990-2000), difference in proportion of college graduates (1990-2000) and difference in proportion of individuals with postgraduate degrees (1990-2000). These are classic least squares multiple regression point estimates. Control variables are summarized in the appendix: population, rent, education, crime, party voting, race, arts industry clusters and the first factor of a principal components analysis on the 15 dimensions of scenes. Subsequent analysis (not reported here) of an expanded model that included some 20 controls revealed substantively similar results.