Figure 4 15 Buscot area The frequency distribution for the Buscot area and the Down Ampney area ar oresented in Fig.4.15 and Fig.4.16 respectively.
Related Figures (129)
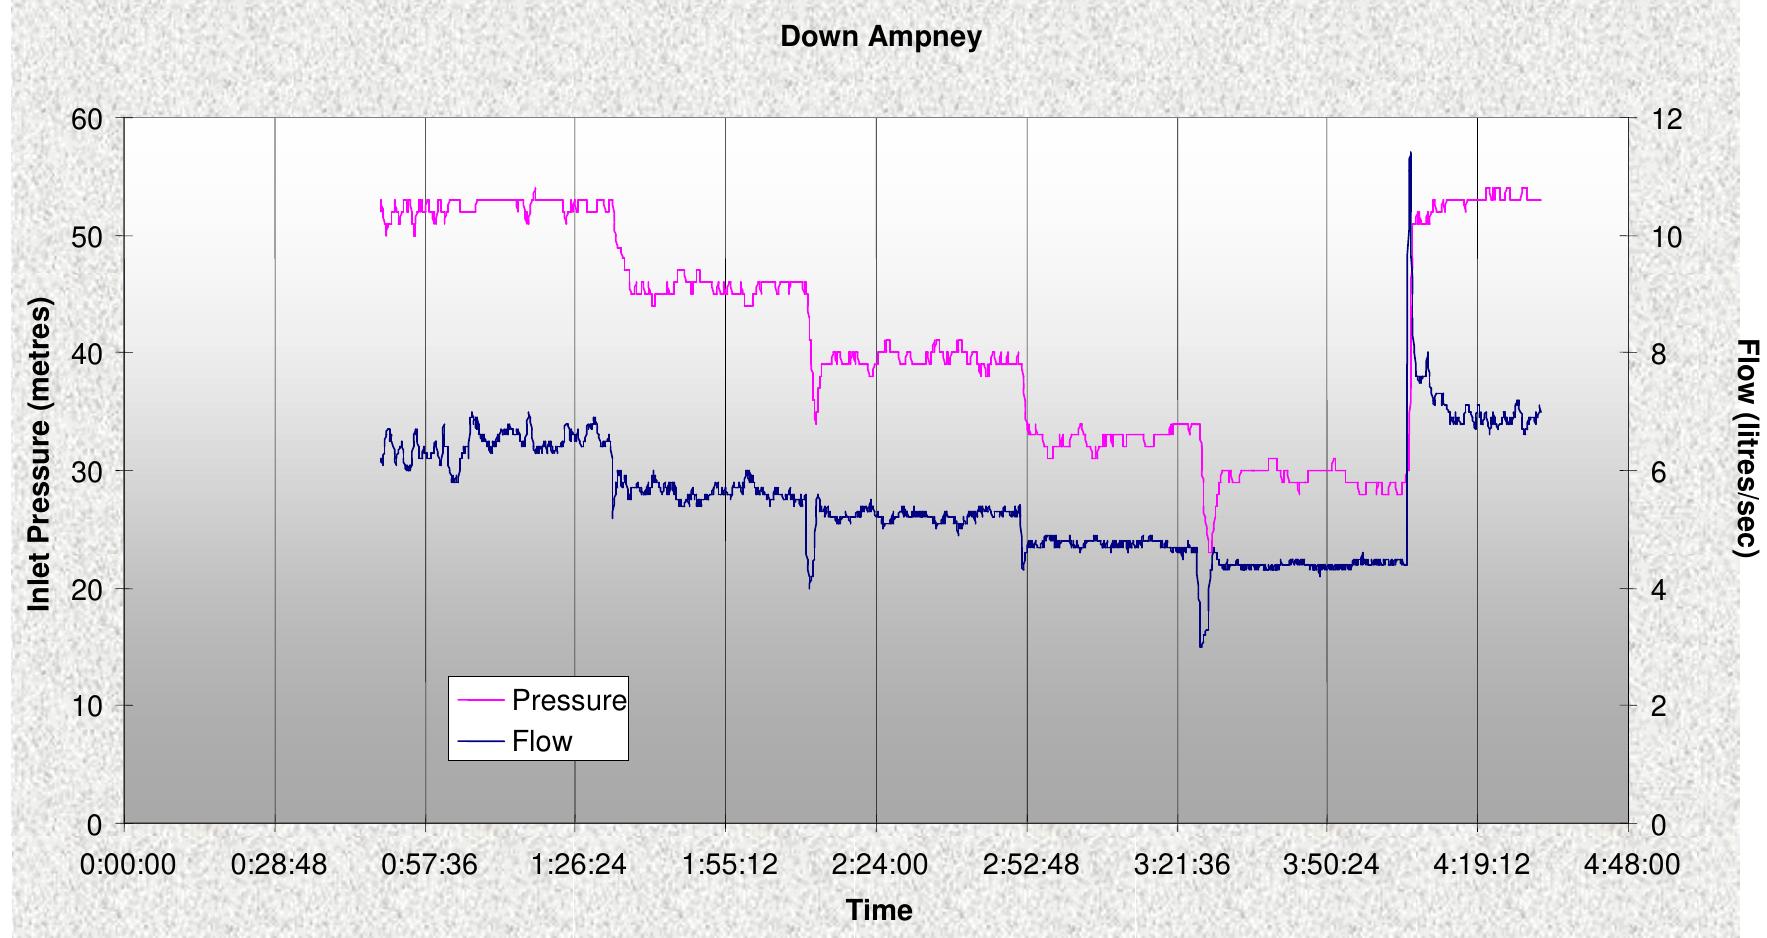
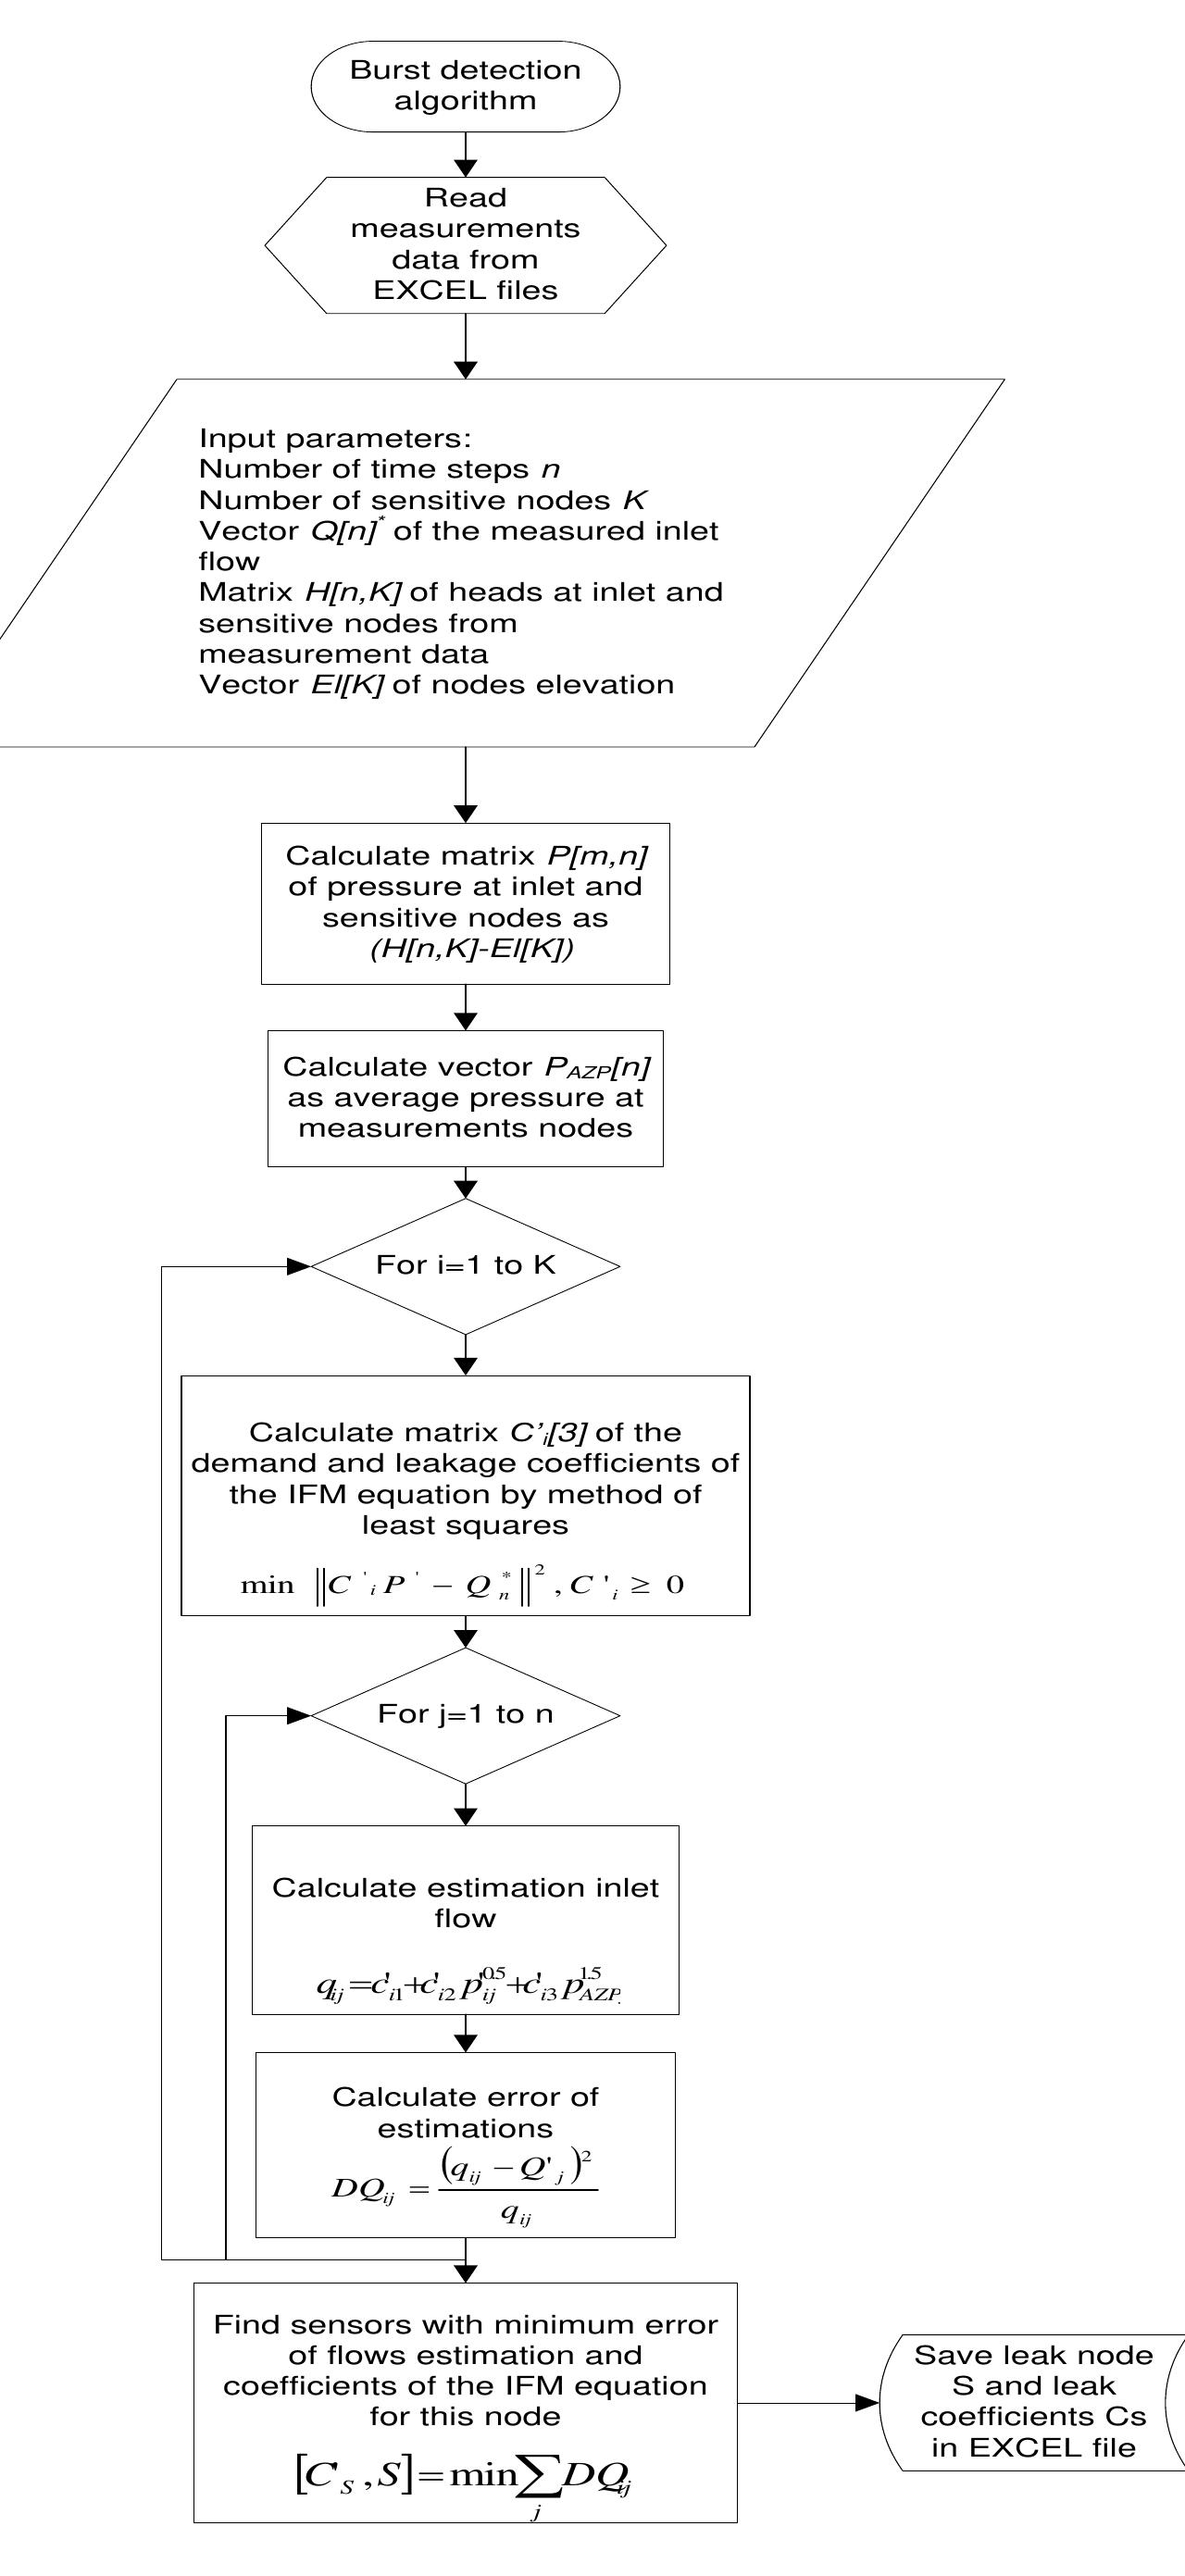
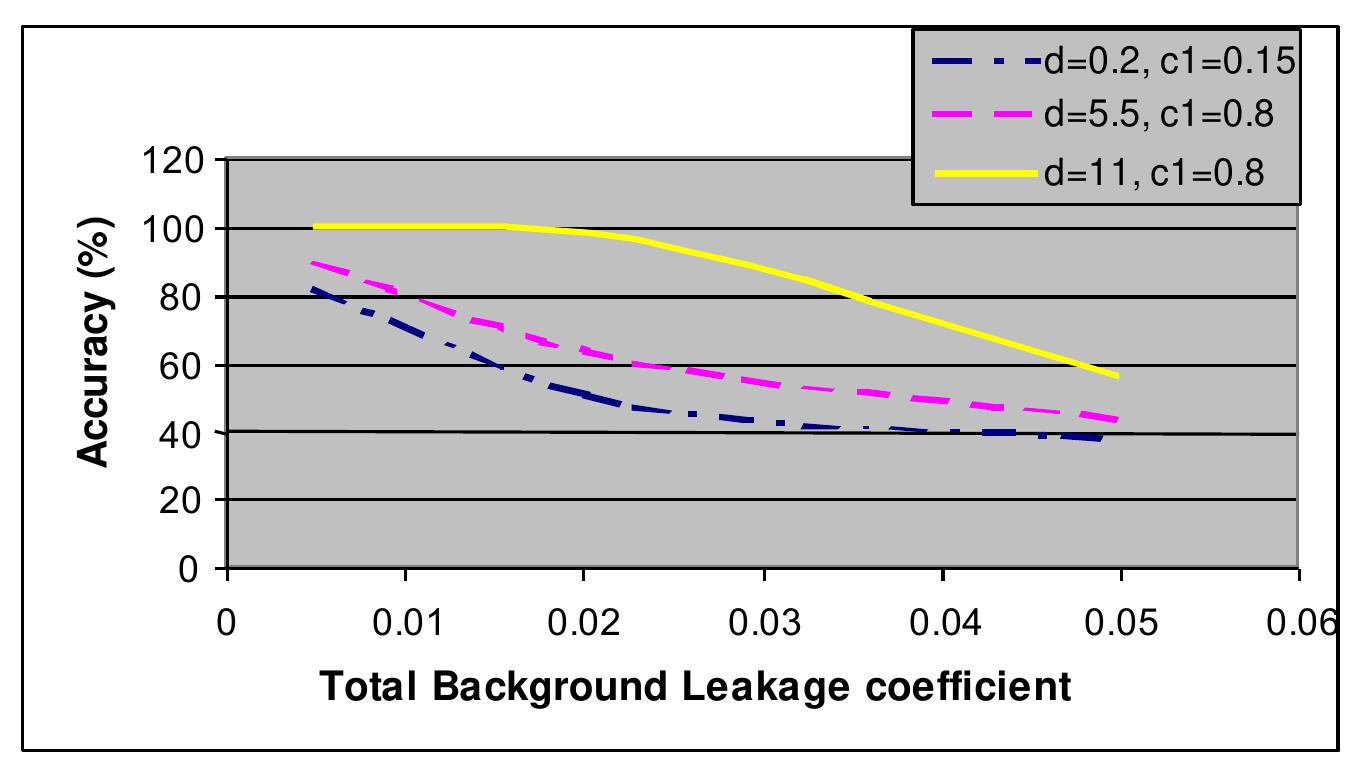
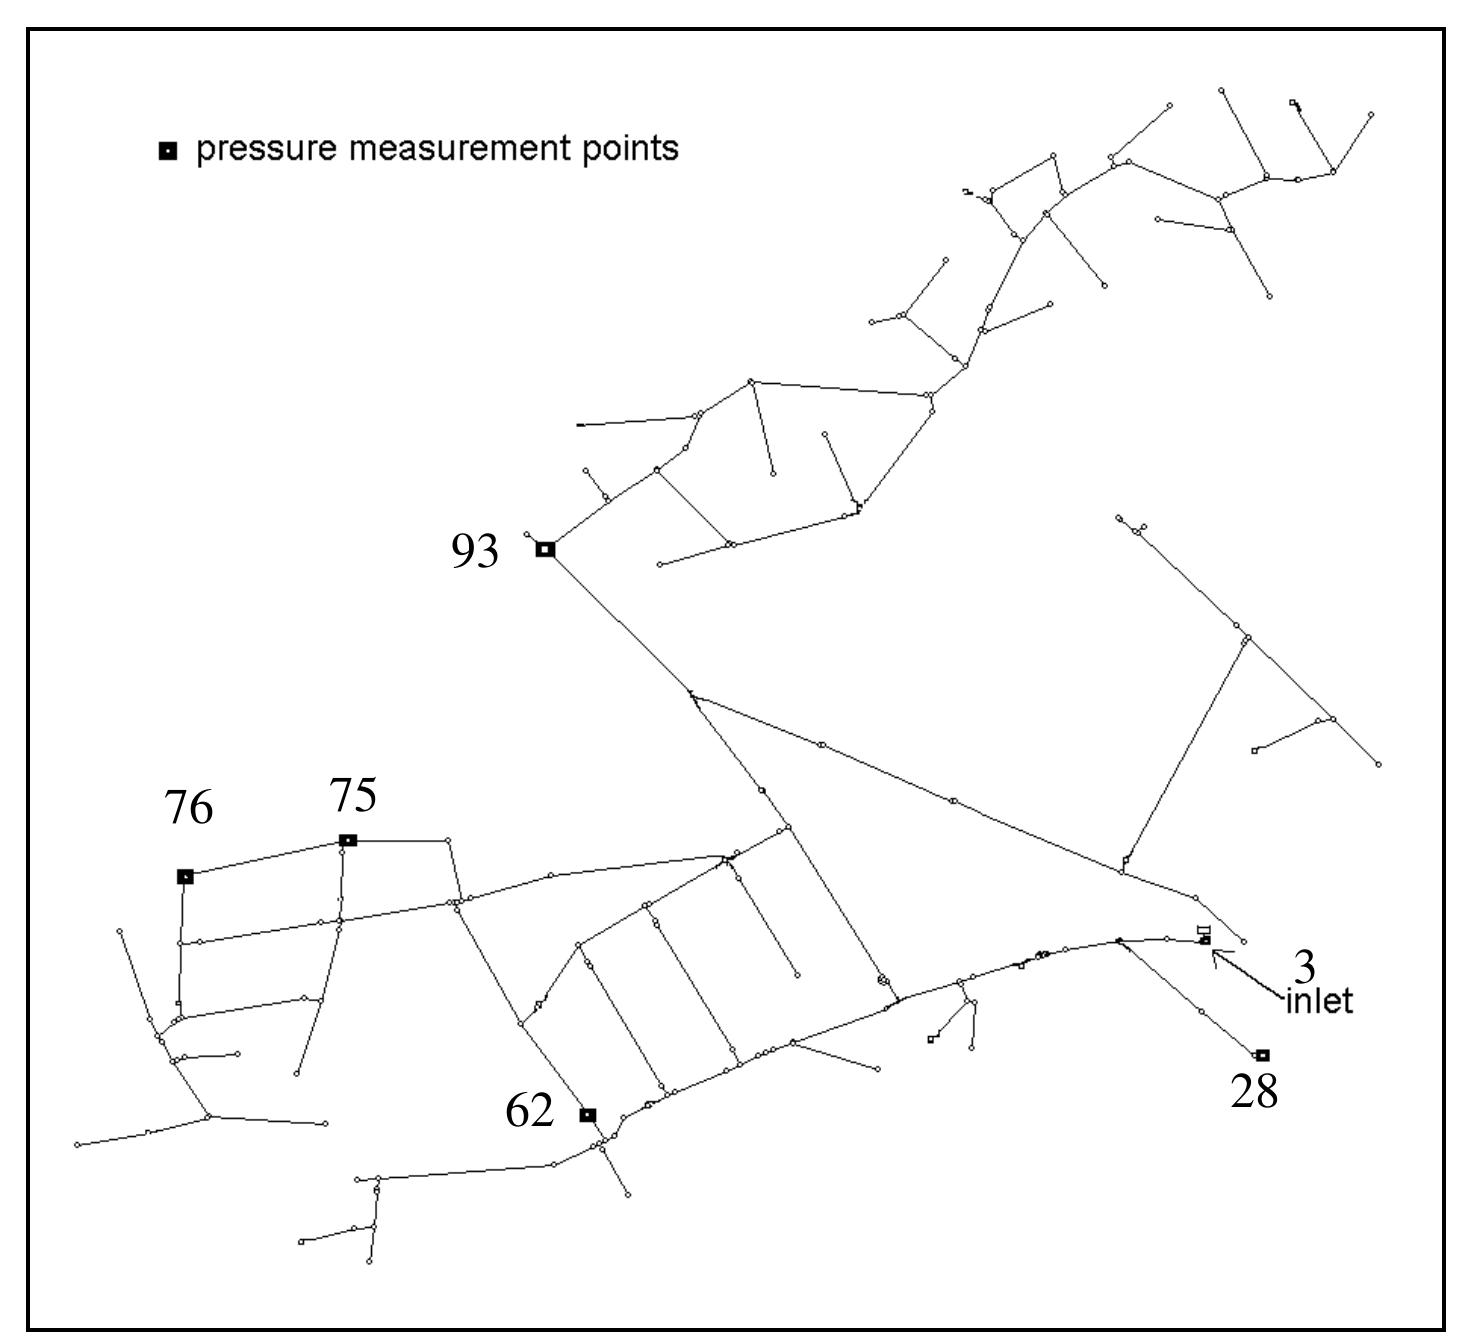
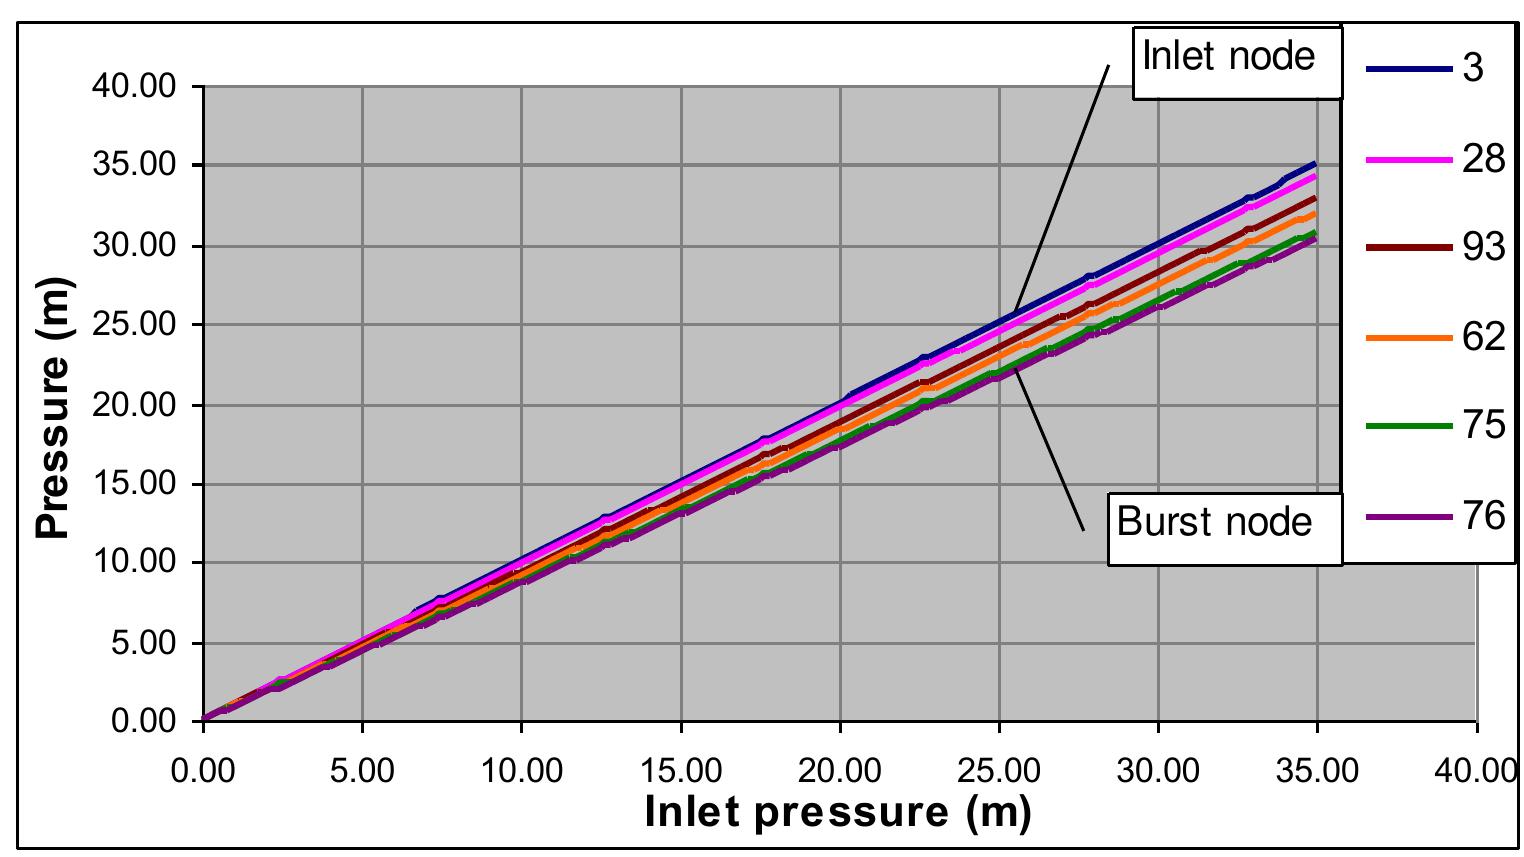
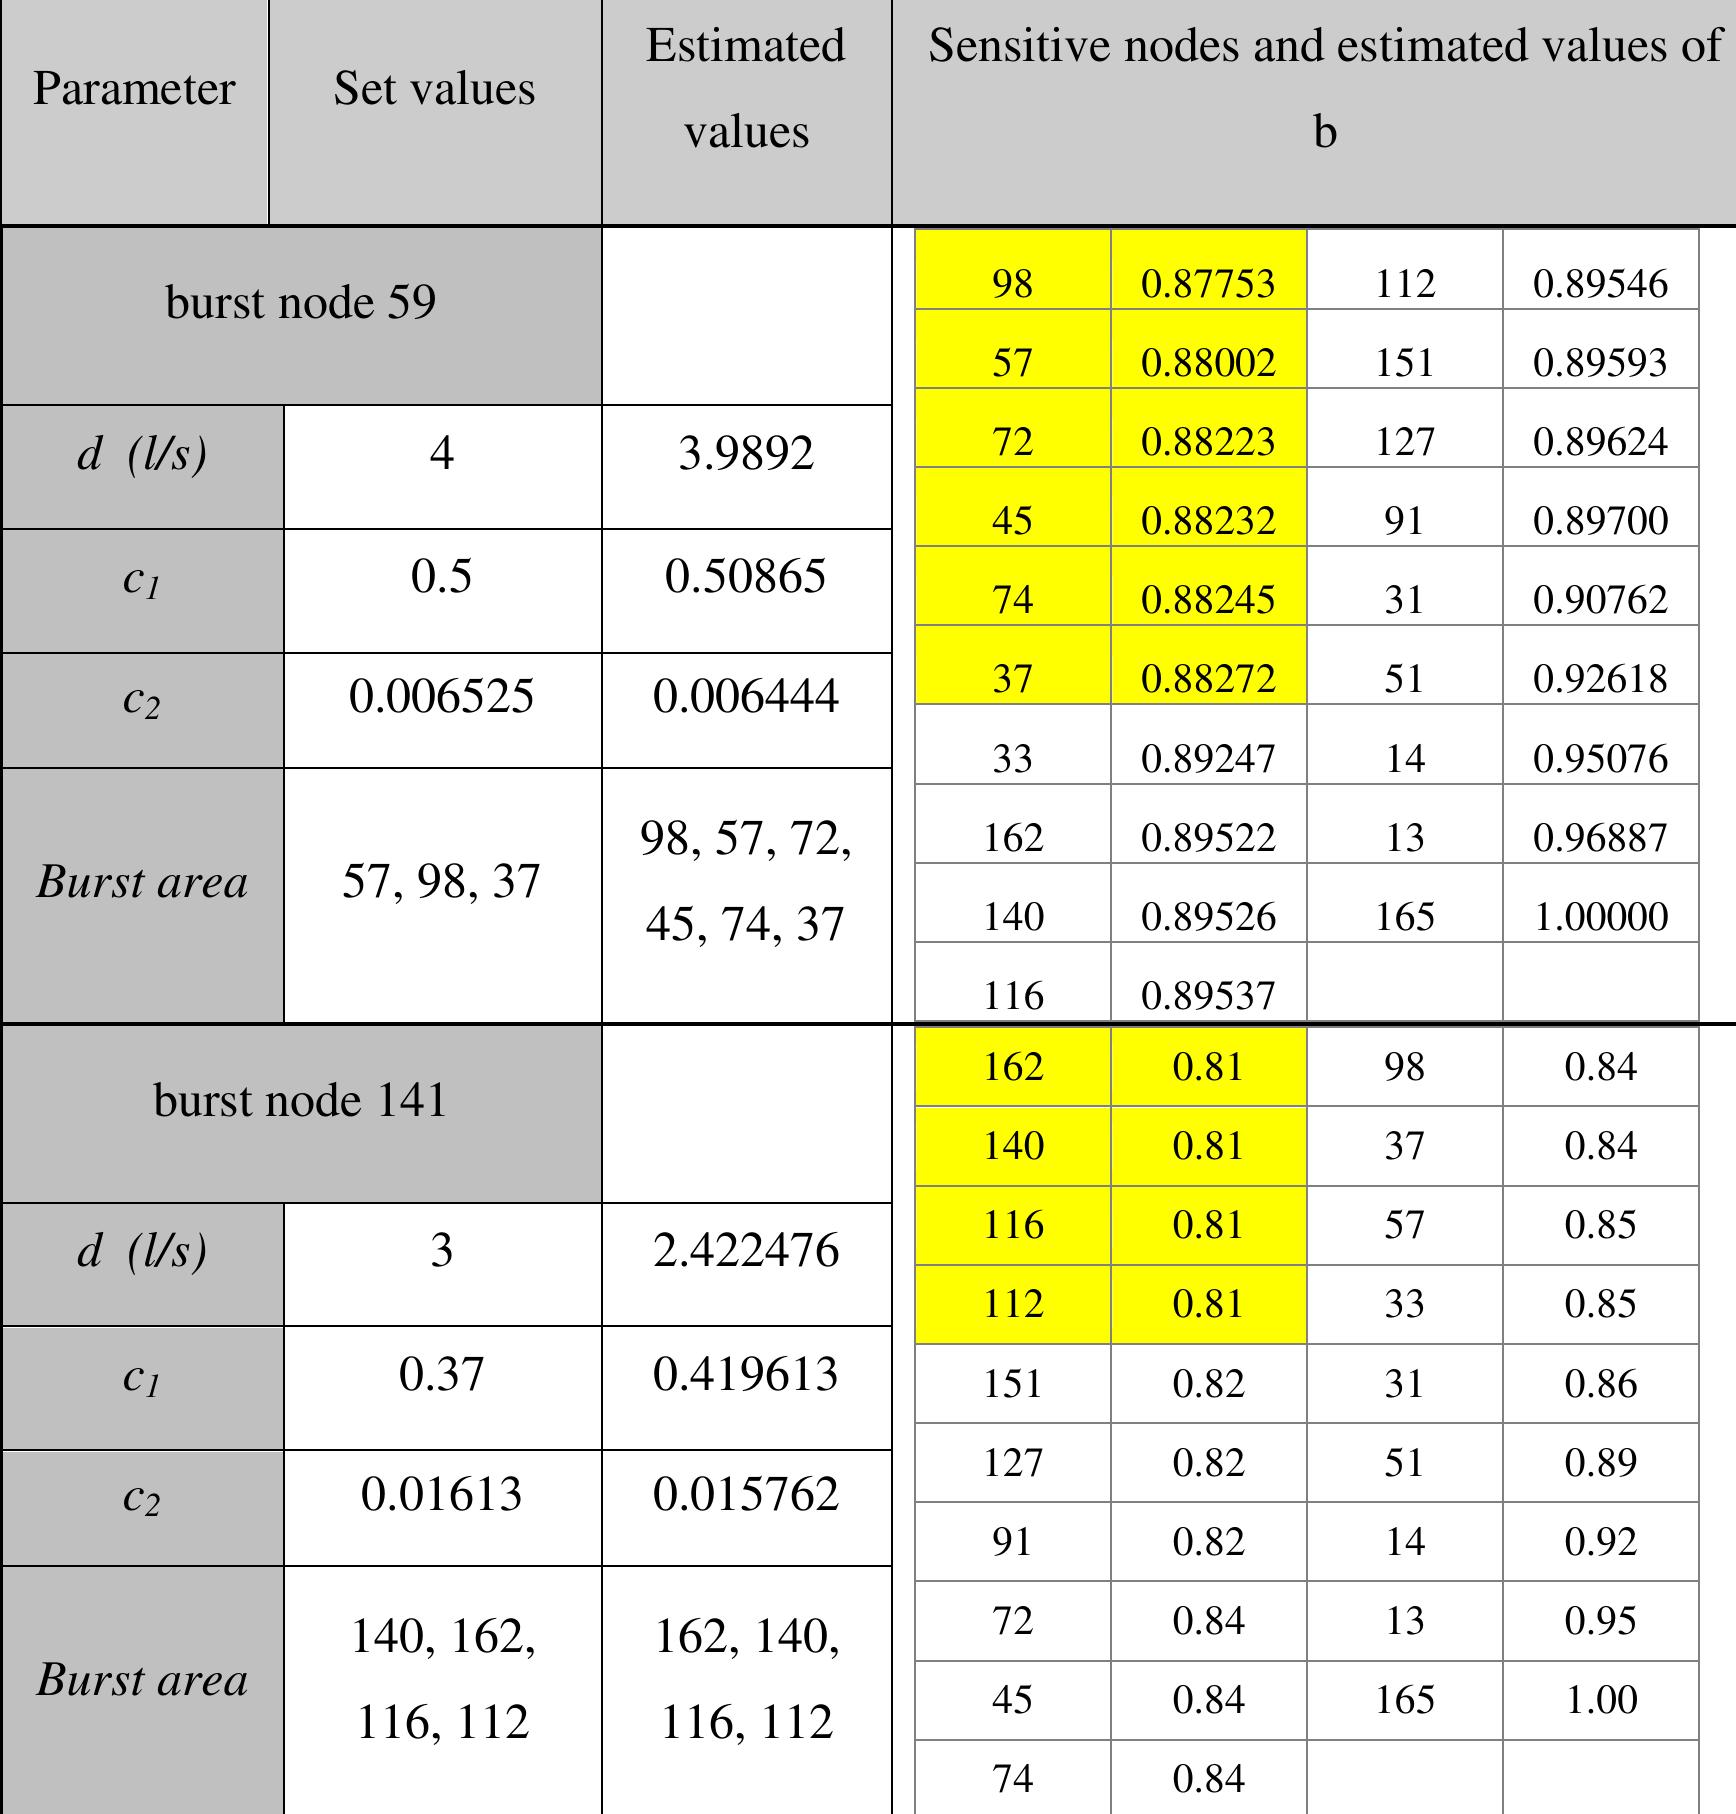
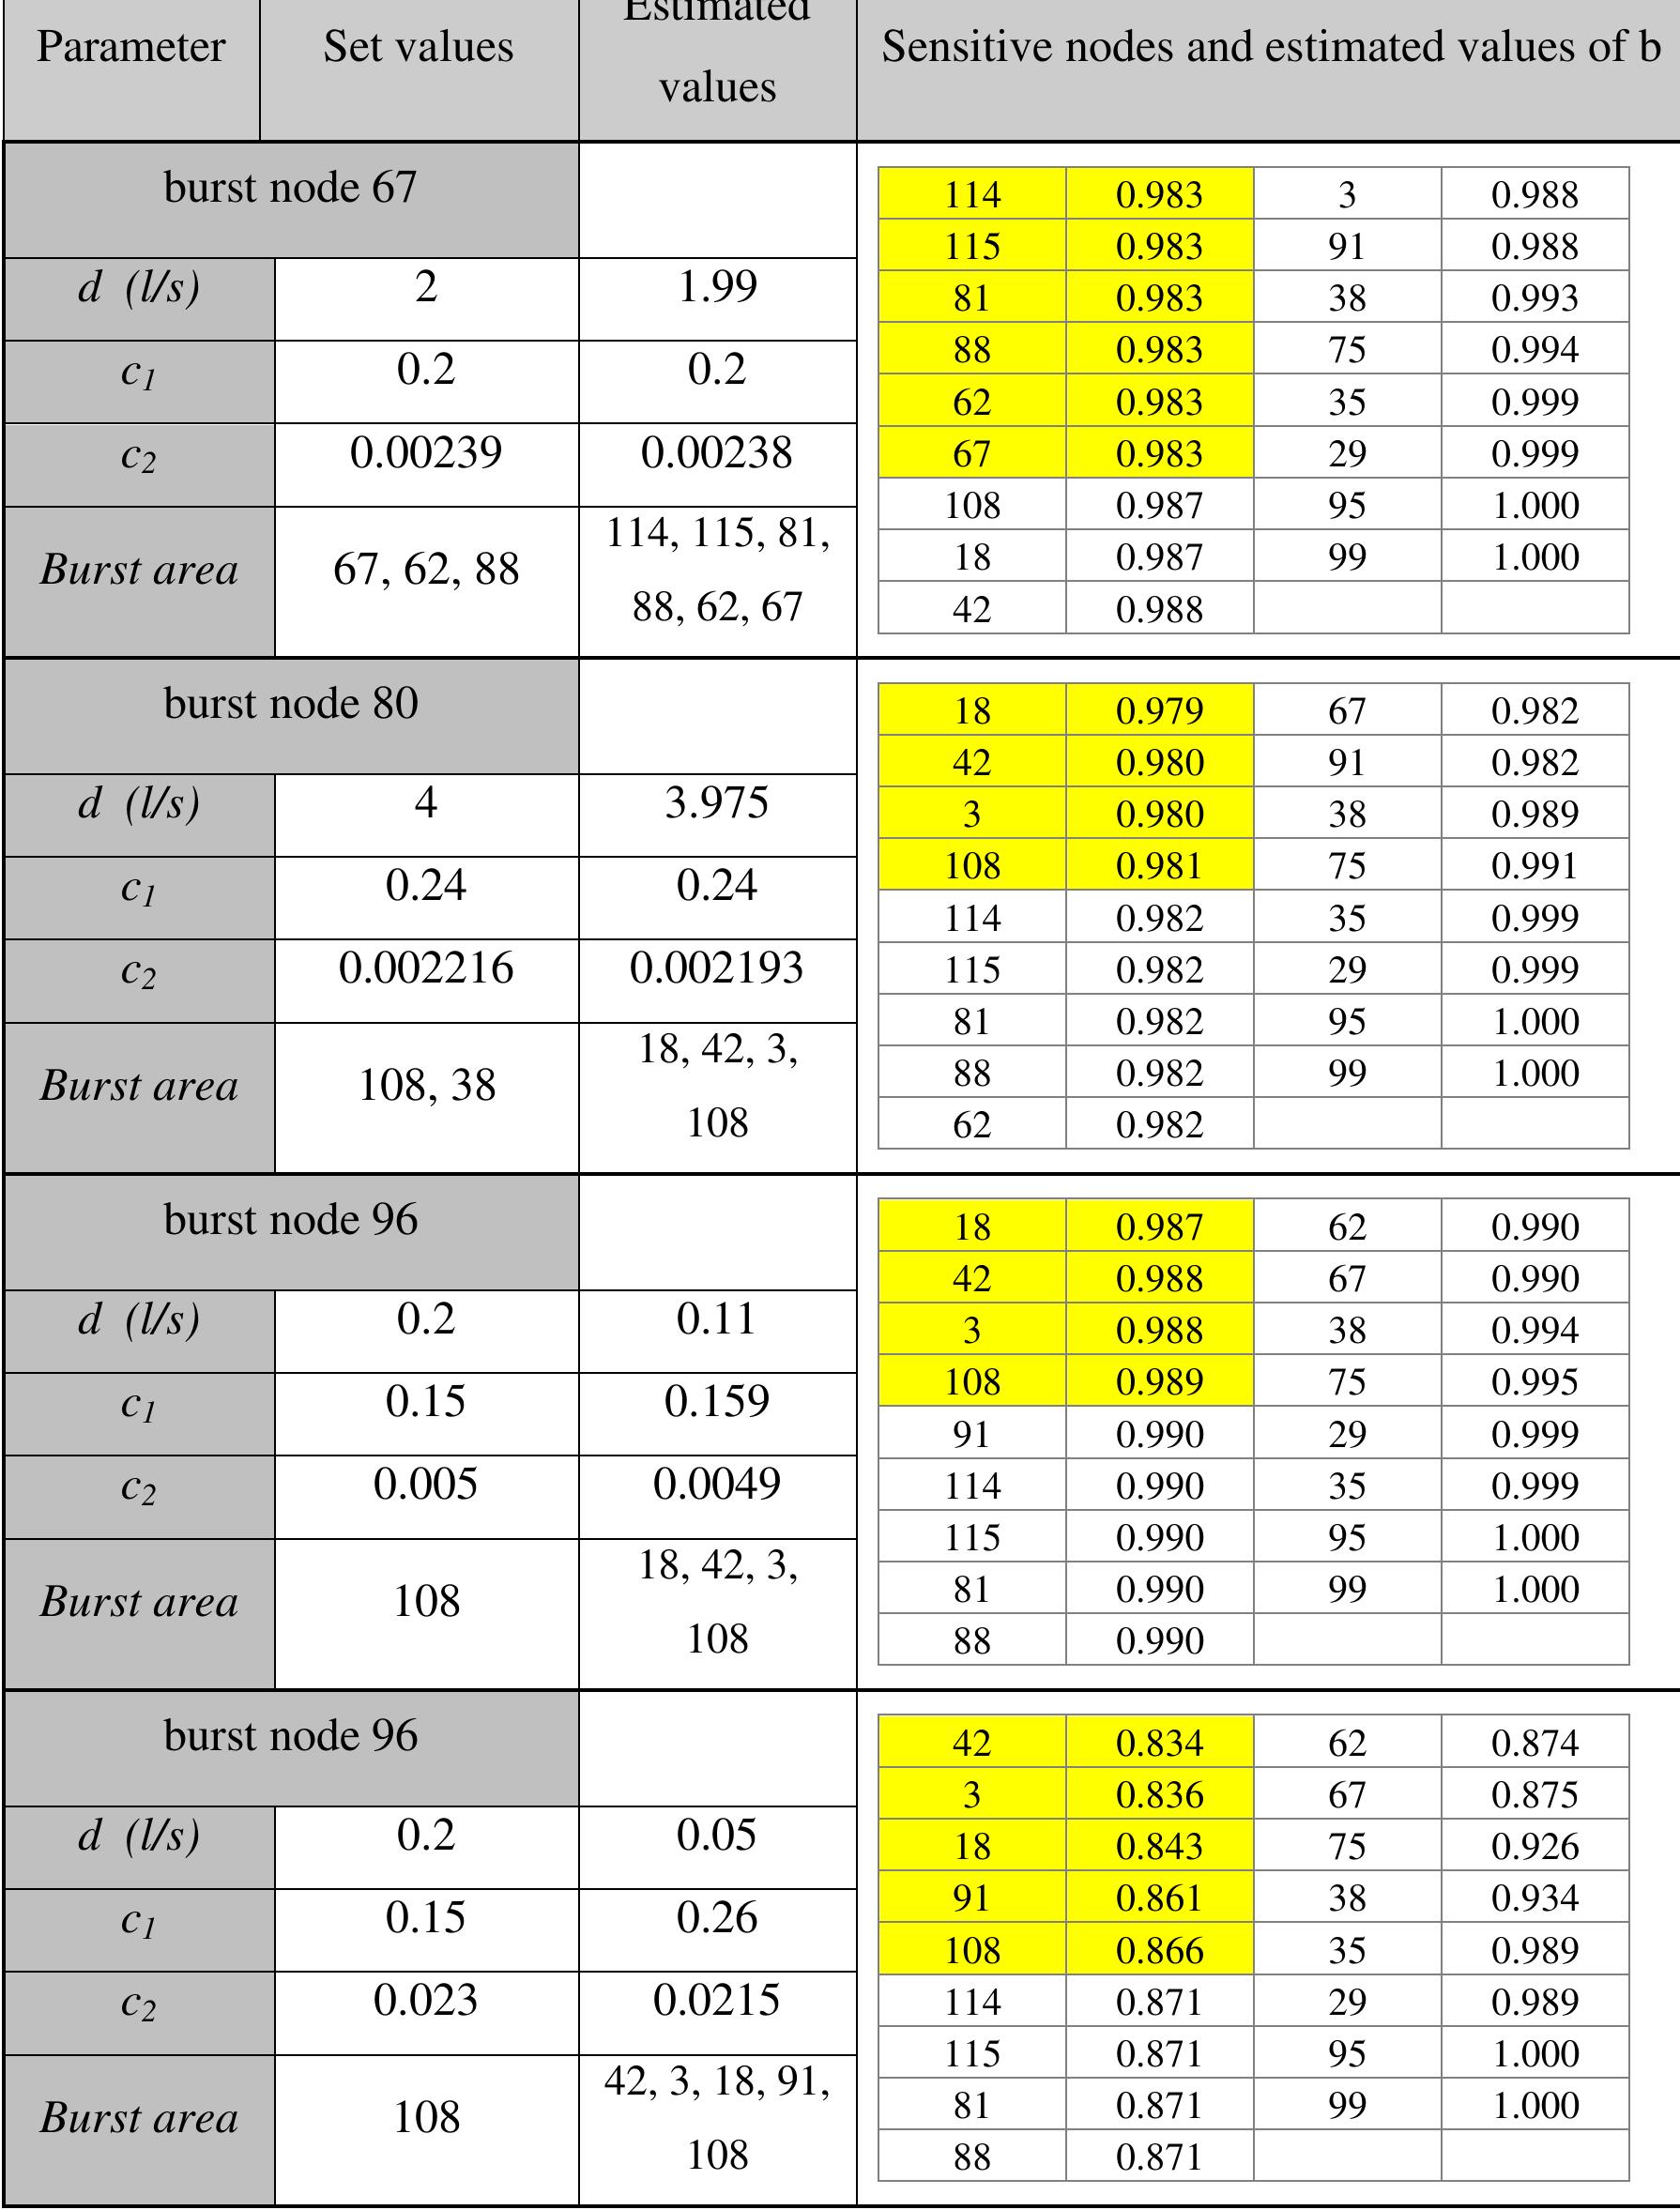
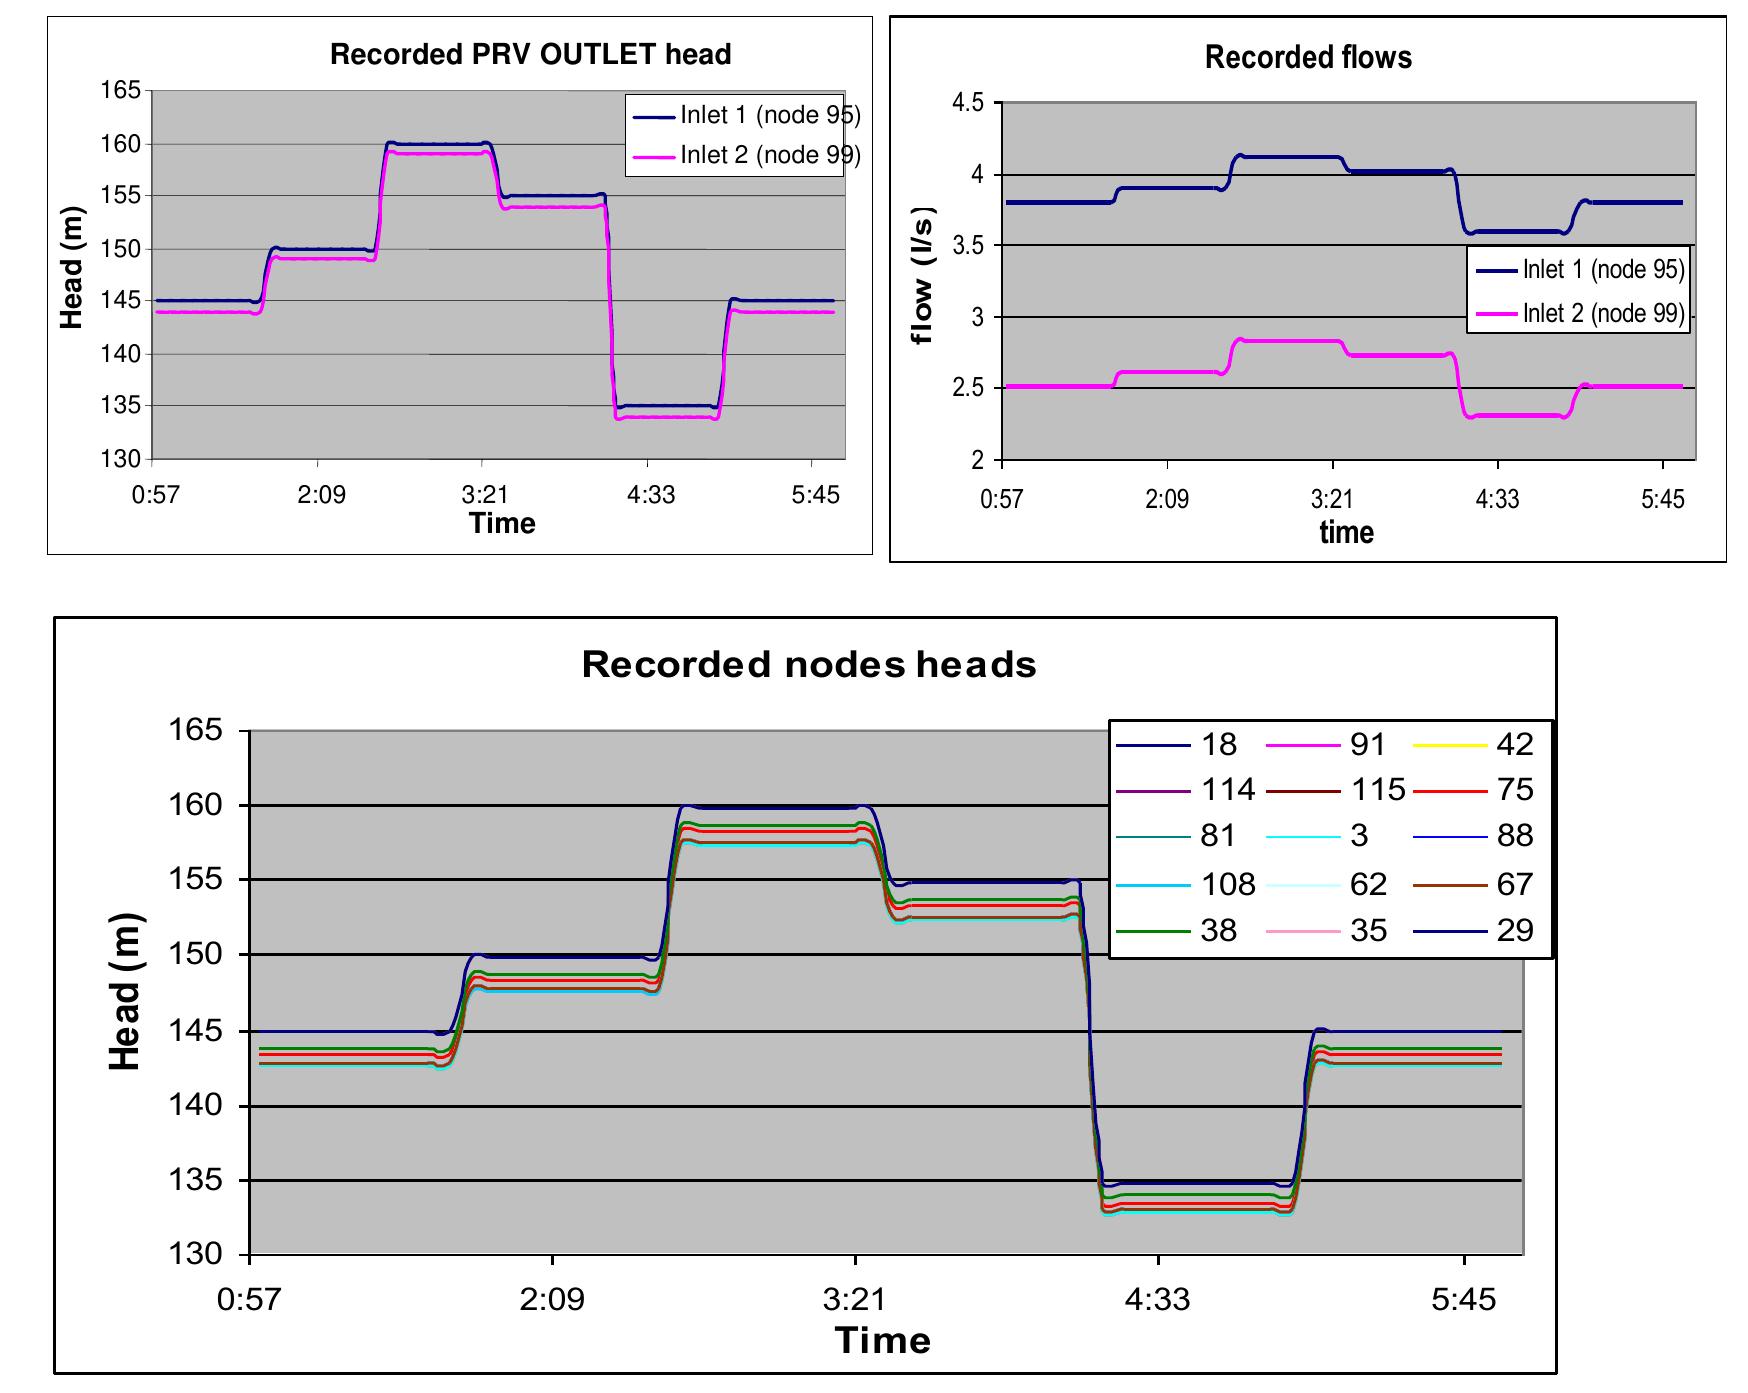
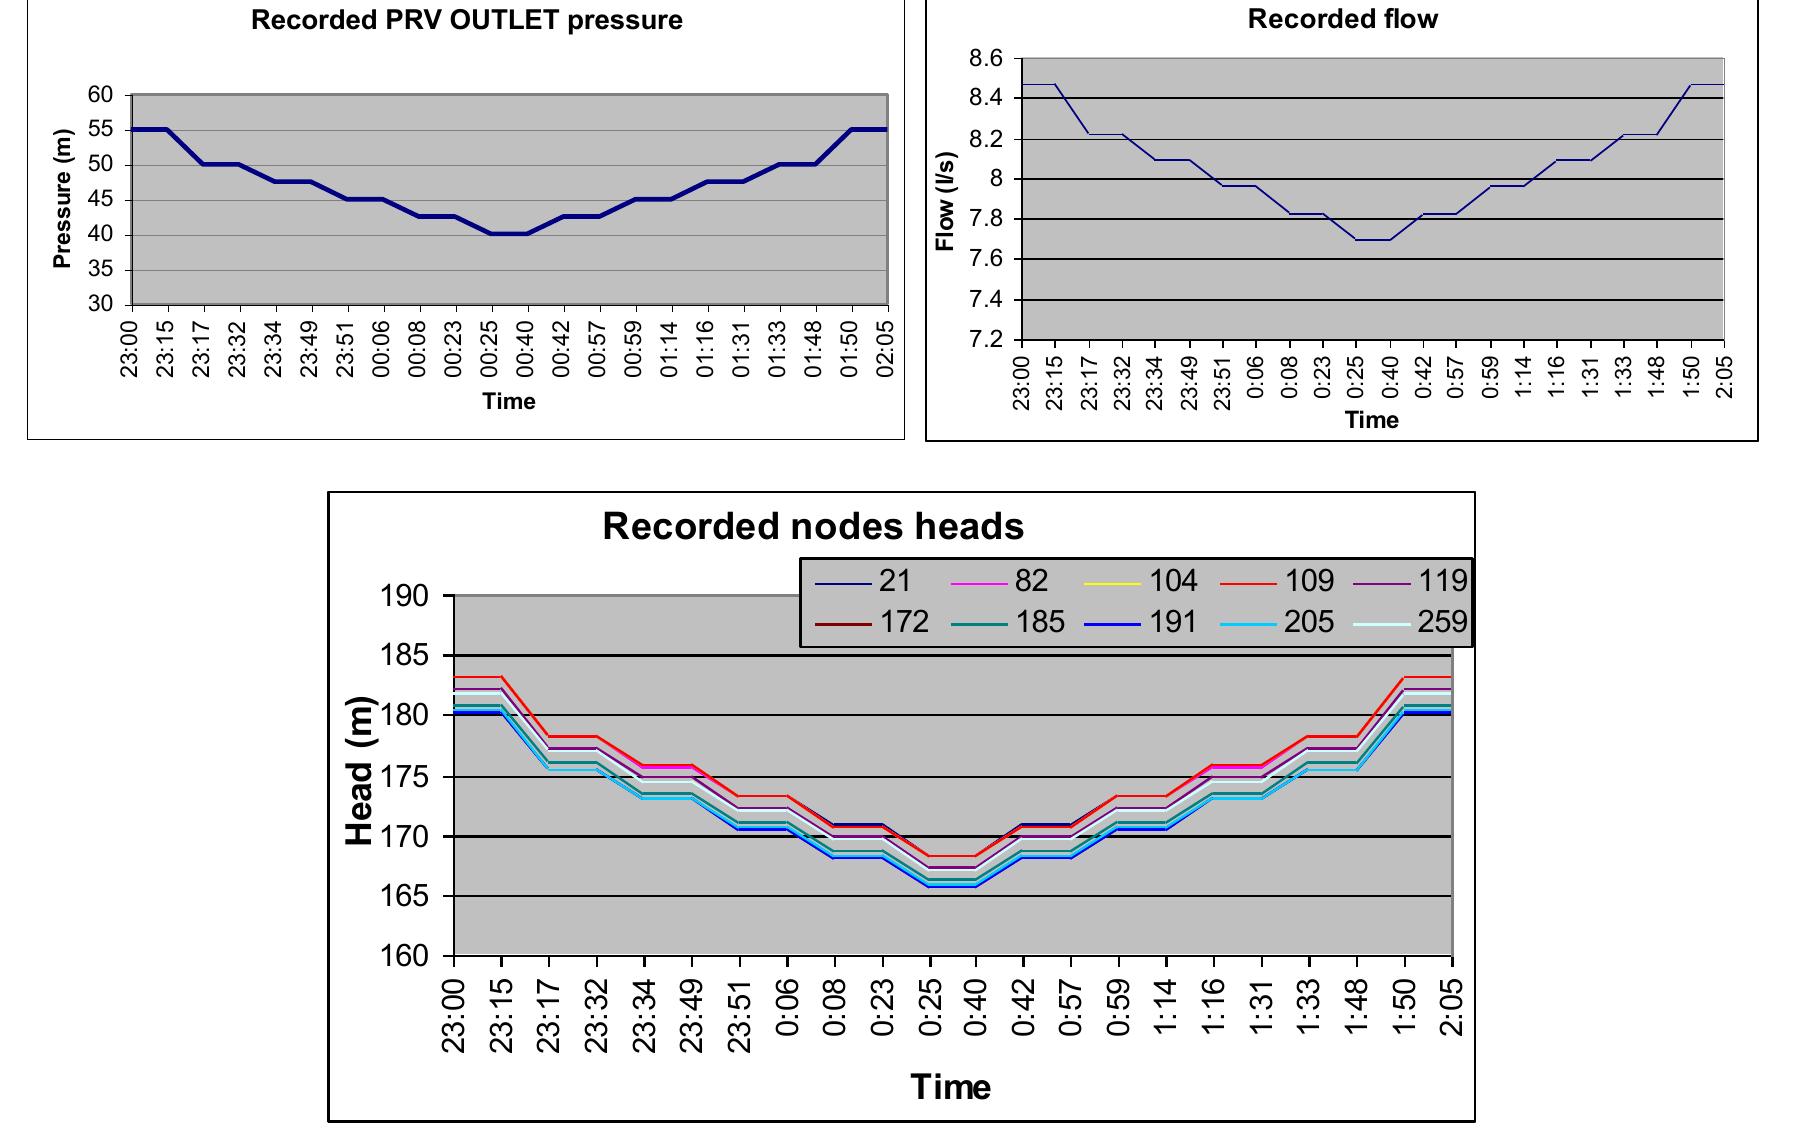
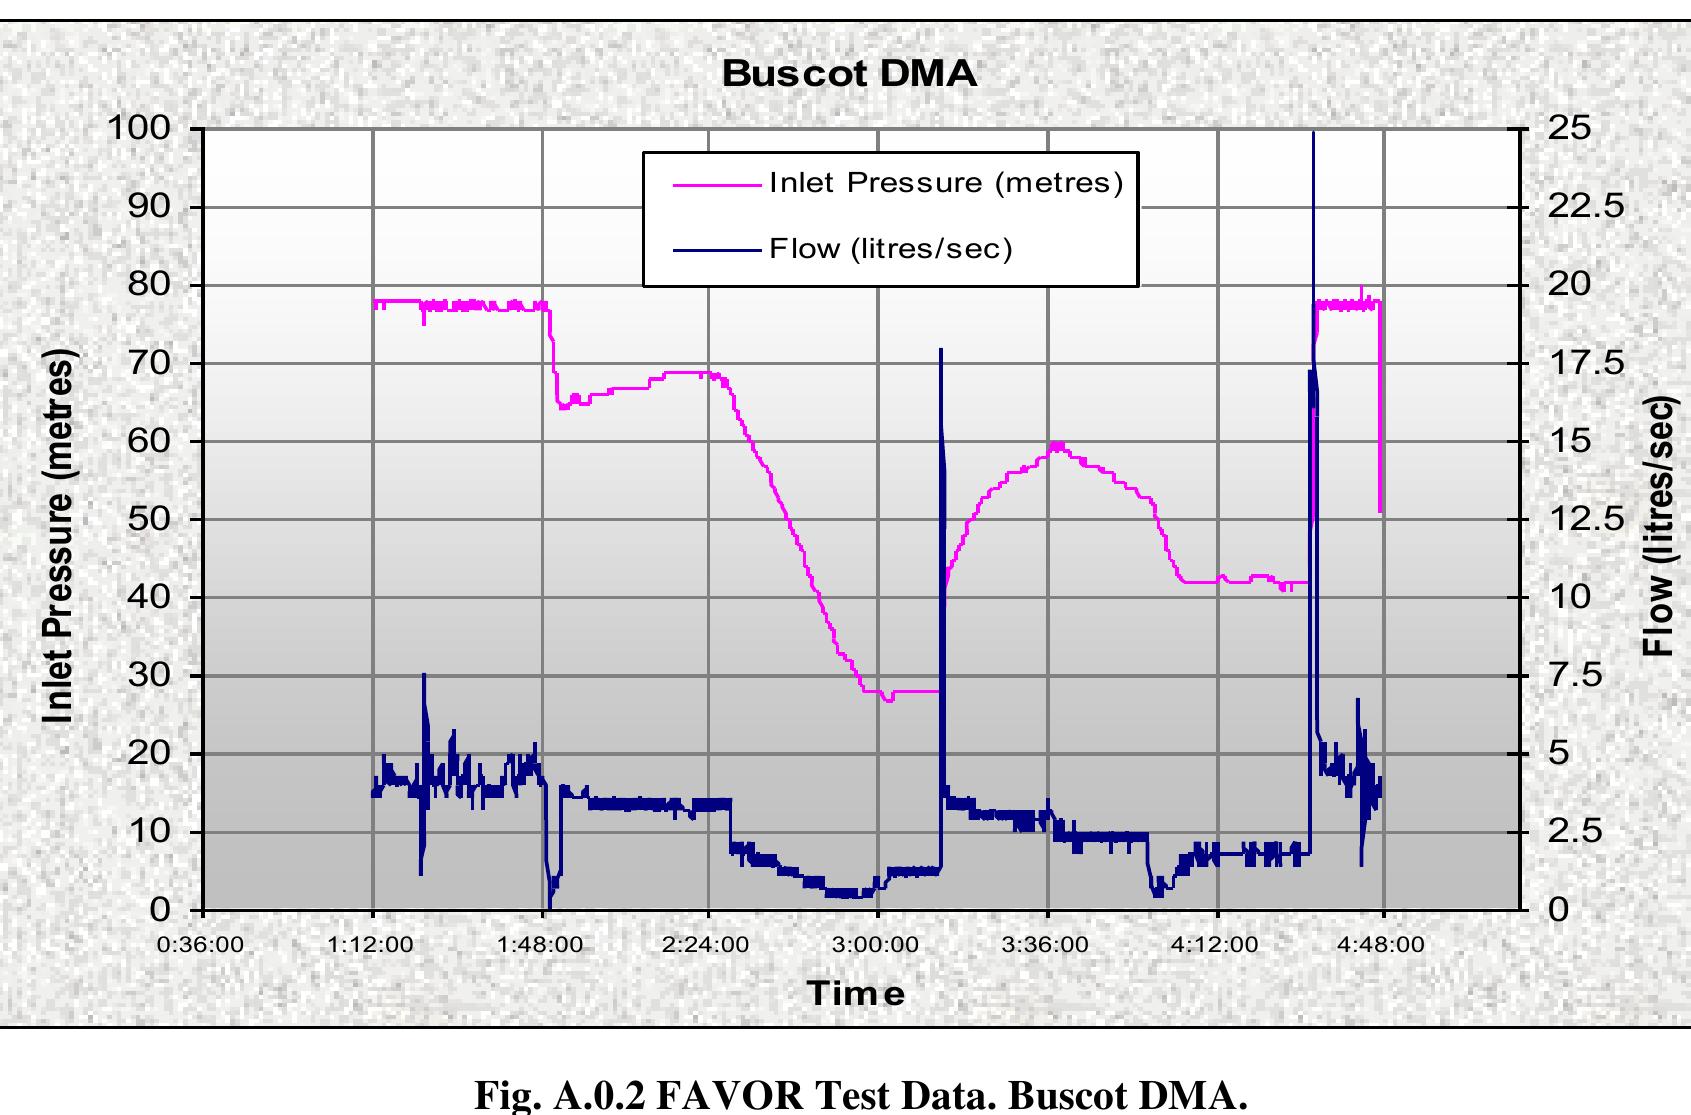
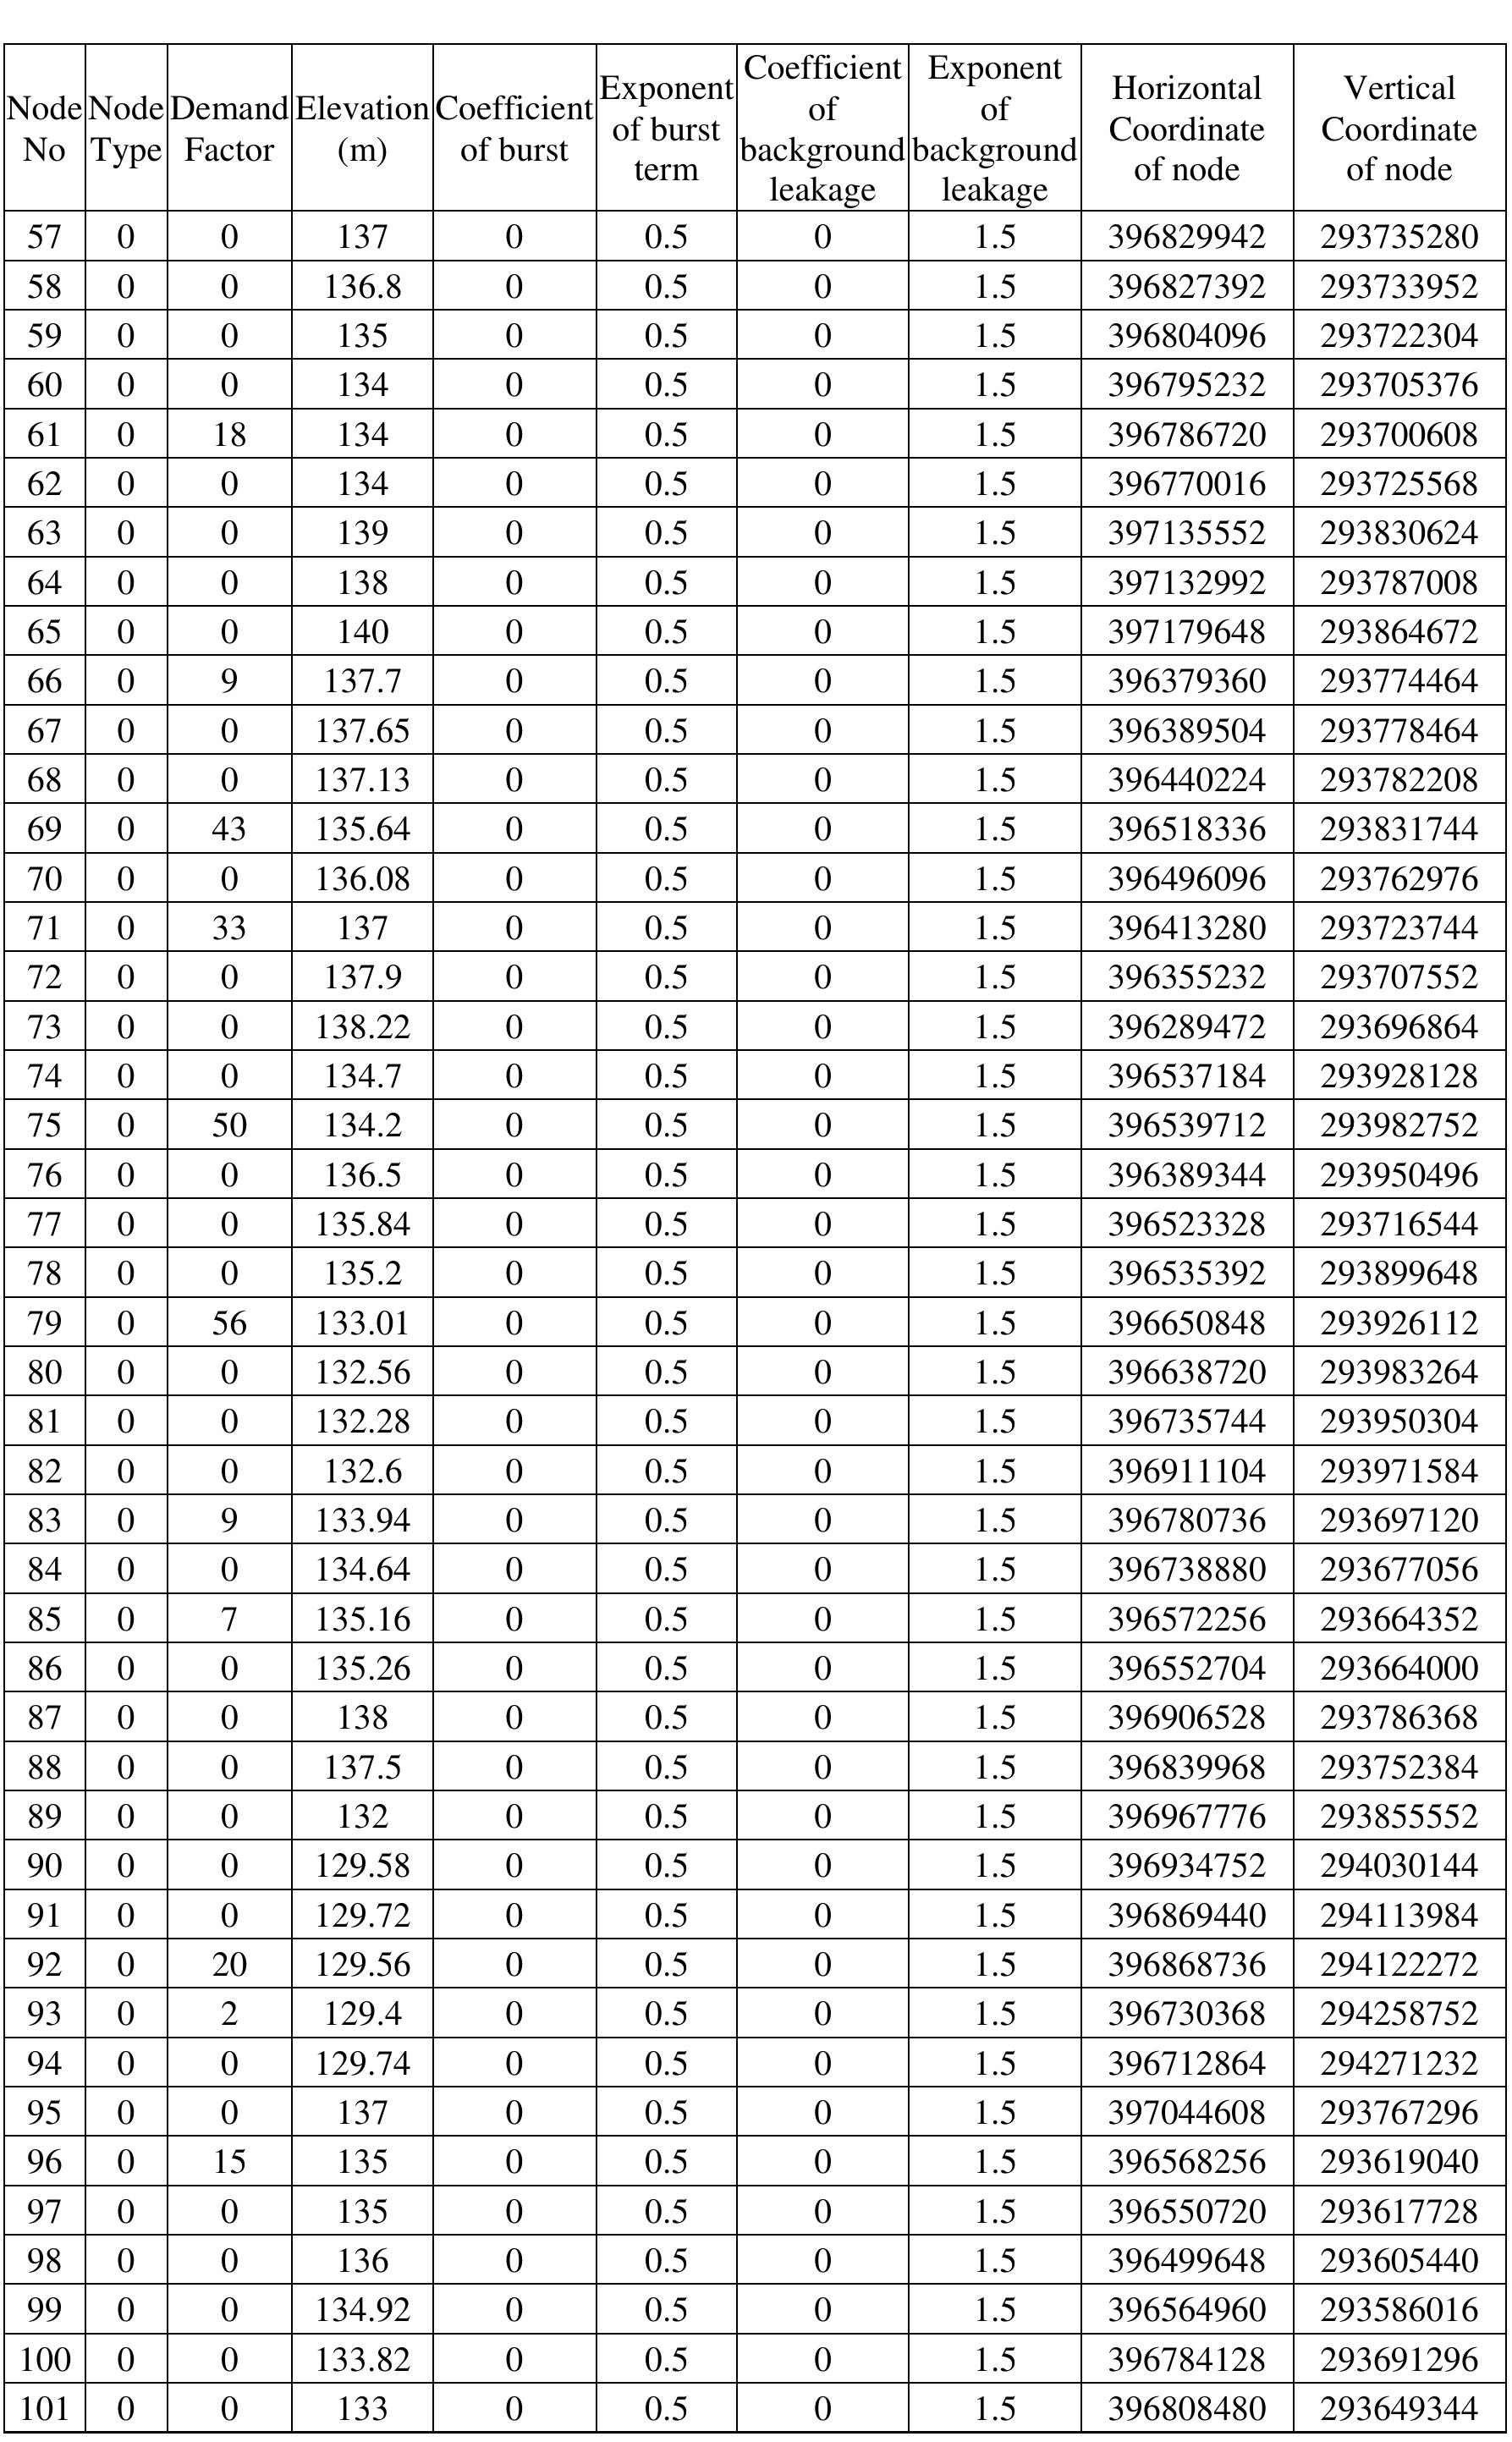
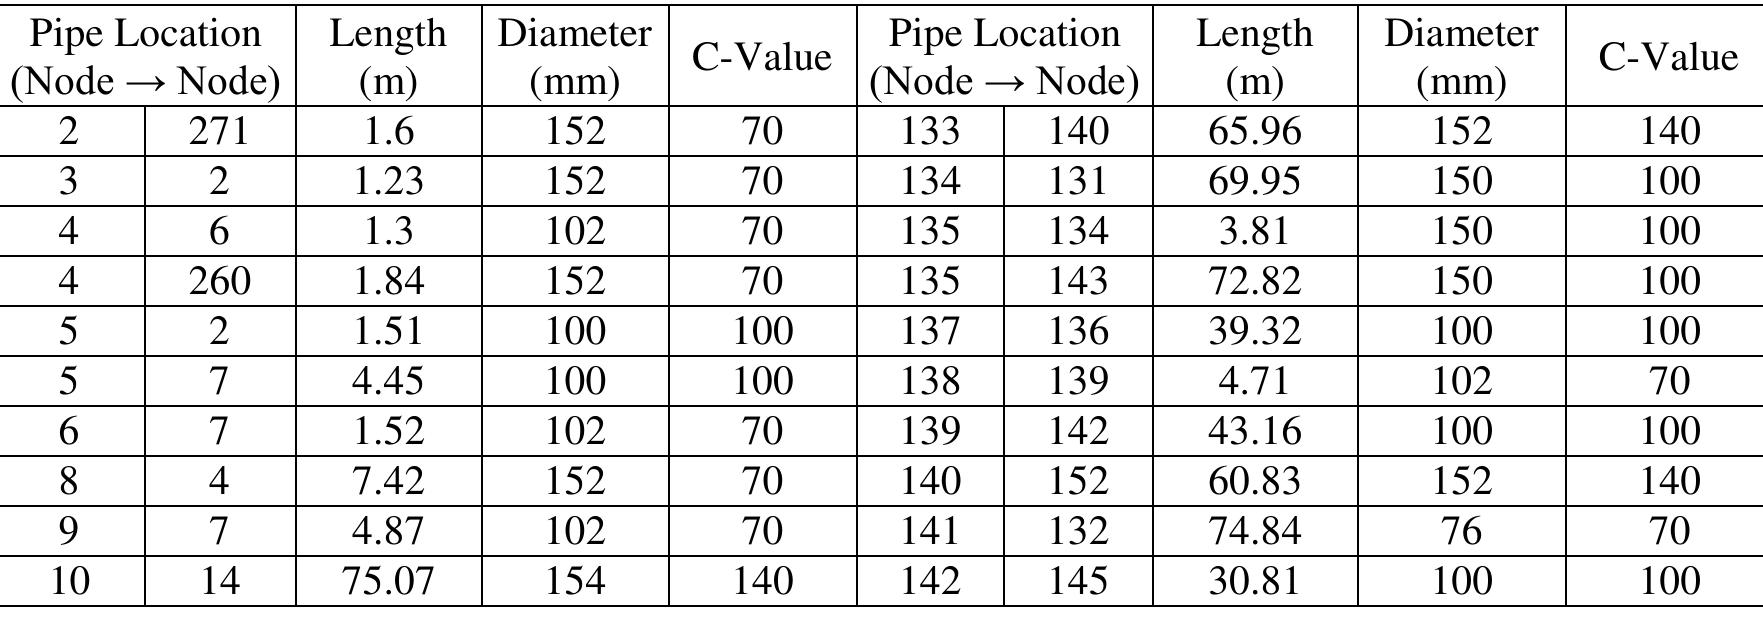
The flow rates of individual leaks depend on the size of the hole, split or crack, and normally reported to the water company by third parties soon after they occur. 50,000 litres/hr, but average duration of only a few hours or days if repairs are carried illustrated in Figure 3.1. The following terms are associated with the model: Table 3.1 The resistance coefficients coefficient for each of the formulas (Streeter & Wylie 1998). Table 4.1 Coefficients and RMS error for seven DMAs The root-mean square error in the three-term model, observed in the table, is smaller model and the three-term model are shown in Table 4.1 below. than the error from the linear model, therefore the three-term model can be used in the investigated. Coefficients and the root-mean square error for seven DMAs for the linear Fig. 4.3 Estimated background leakage coefficients using inlet pressure same. The coefficients of background leakage are not linearly correlated as illustrated ir the inlet flow model (IFM). In this model the inlet pressure was used to represent the estimated ones. Because these differences have the same magnitude the total flow is th The results are depicted in Figure 4.4. It can be observed from the chart that this is an affined relationship and can be describec by a straight line equation: Coefficients of the background leakage are linearly correlated (Fig. 4.5: Fig. 4.5 Background leakage coefficient using AZNP. demand coincides with the given ones (Fig. 4.6). The comparison between simulated (set) and estimated flows is presented in Fig.4.8, it The outcomes of the repeated experiment using AZNP for calculations are not very Table 4.5 Simulated (set) and estimated flows Fig. 4.9 Estimated burst coefficients using AZNP pressure from the simulation (pre-set) one (Fig.4.10). Fig. 4.10 Estimated burst coefficients using inlet pressure (burst at node 352) yurst and the demand remain the same. The estimated coefficient differs significantly negative outcome, but with a smaller error. Fig. 4.11 Pressure at the node of the burst Repeating the experiment with AZNP instead of the inlet pressure gives the similar value to the burst node pressure. Table 4.6 Estimated coefficients (for one burst) Table 4.6. Table 4.7 Estimated coefficients (for two bursts) square method: with one burst and the corresponding IFM coefficients are obtained using the least is added to the demand flow, but the background leakage flow is determined precisely Table 4.9 The estimated coefficients (network without burst) the demand and the background leakage flow g=d+c,Pi>yp and is displayed in Tabl Table 4.10 The result of calculation (network without burst) Table 4.12 The estimated coefficients (network with burst) Table 4.13 IFM coefficients Table 4.14 The obtained results Table 4.15 Frequency of occurrence of the demand frequencies are shown in Table 4.15. Table 4.16 The probability of occurrence of a demand The theoretical probability density f(x) can now be calculated for each demand level range can be calculated, examples are given in Table 4.18. Table 4.18 The demand distribution Similar calculations have been performed for other water distribution zones. The density The mean value of the demand in each case is equal to the demand value in the IFM. Fig. 5.1 Ocker Hill DMA schematic Appendix C and for Shenstone are shown at Appendix D. measurements being available. Node and element data for Ocker Hill are shown at Table 5.1 Ocker Hill DMA calculated results Table 5.2 Shenstone DMA calculated results Fig. 5.5 Statistical and estimated inlet flows statistical (obtained from simulation) and the estimated (calculated from equation 5.4) Where the values highlighted in yellow correspond to the minimum values of 7°. y> depicted in Tables 5.3 and 5.4 have been obtained. Table 5.4 Shenstone DMA y * values. In the ideal situation of full consistency between the statistical and the theoretical data, A summary of all experiments carried out by the author (about 30 experiments) including those which have not been described here is given below. coefficients were from a sensitive node and not from the exact burst node. Table 5.6 Model data Fig. 5.7 A flowchart of a burst size estimation algorithm simulated inlet flow (‘measurements’) are collected from nodes 99 and 95. Table 5.7 Determination of leakage coefficients where x,, and x, are the simulated parameter value and the estimated parameter value. only one parameter has been varied in a group. The level of accuracy was calculated Fig. 5.9 The result's accuracy from value of Demand Fig. 5.10 The result's accuracy from value of the burst Table 5.8 Pressure at nodes of the network (without burst) ‘he pressure at each node of the network increases linearly with the increase of the inlet Table 5.9 Pressure at nodes of the network (with burst) changes at all the nodes of the network is given in Figure 5.13 below. Fig. 5.13 Diagram of pressure change in the network nodes (with burst) the pressure at the inlet node and remaining nodes. A general diagram of pressur Fig. 5.14 Ocker Hill DMA schematic (pressure measurement points) and nodes 93 and 28 which are in other parts of the network (Figure 5.14). The pressure changes at the selected nodes are illustrated Figure 5.15. Fig. 5.15 Diagram of pressure change in the network nodes burst node and the biggest gradient for the inlet node. values of inlet flows. Table 5.10 The values of coefficients The gradients of the lines corresponding to the sensitive nodes are within the limit: Table 5.10 are obtained. Table 5.11 Received coefficients of regression lines Fig. 5.18 The Shenstone DMA schematic (with burst) Table 5.12 Ocker Hill DMA calculated results. The performed experiments have confirmed that by investigating the pressure changes identification results are normally quite accurate for such a topology. accuracy of burst area identification depends on the number of loggers in a branch. The the inlet and the water arrives at an extreme node along a unique path. In this case the Fig. 5.20 A flowchart for burst location identification Table 5.14 Ocker Hill DMA burst location results Table 5.15 Shenstone DMA burst location results The intuitive method resulted in uniform distribution of the loggers over all parts of the Table 5.16 The results of experiments with other "Sensitive nodes" Table 6.2 Results of the burst location identification algorithm (Ocker Hill DMA) Fig. 6.3 Fixed area burst leakage in Ocker Hill DMA The recorded data obtained during the field experiment are presented in Figure 6.5. Table 6.4 Results of the burst location identification algorithm (Shenstone DMA) Fig. 6.6 Shenstone DMA, results of the experiment. coefficient of the total background leakage is 0.00227. Fig. 6.8 First part of experiment. Recorded data. Table 6.6 Results of the burst location identification algorithm (First part of experiment) the total background leakage is 0.001366. 0.655 (which corresponds to a burst flow of about 5 I/s), the value of the coefficient of Table 6.7 Calculated results (Second part of experiment) Table 6.8 Results of the burst location identification algorithm (Second part of experiment) Fig. 6.11 E054 DMA. Results of second part of experiment. 20-seconds intervals. The results of the FAVOR Test are shown below. Fig. A.0.4 FAVOR Test Data. Farringdon DMA. Fig. A.0.5 FAVOR Test Data. Priosfeild DMA. rig. A.0.6 FAVOR Test Data. Shellingford DMA. Table B.0.1 Node Data for Frizinghall DMA Table B.0.2 Element Data for the Frizinghall DMA Table C.0.1 Complete nodes data for the Ocker Hill DMA other variable. Table D.0.1 Complete nodes data for the Shenstone DMA other variable. , J — Horizontal and vertical co-ordinates of a node on the map. They do not affect any Table D.0.2 Complete element data for Shenstone DMA Table E.0.1 Complete nodes data for the E054 DMA other variable. Table E.0.2 Complete element data for E054 DMA


