580 California St., Suite 400
San Francisco, CA, 94104

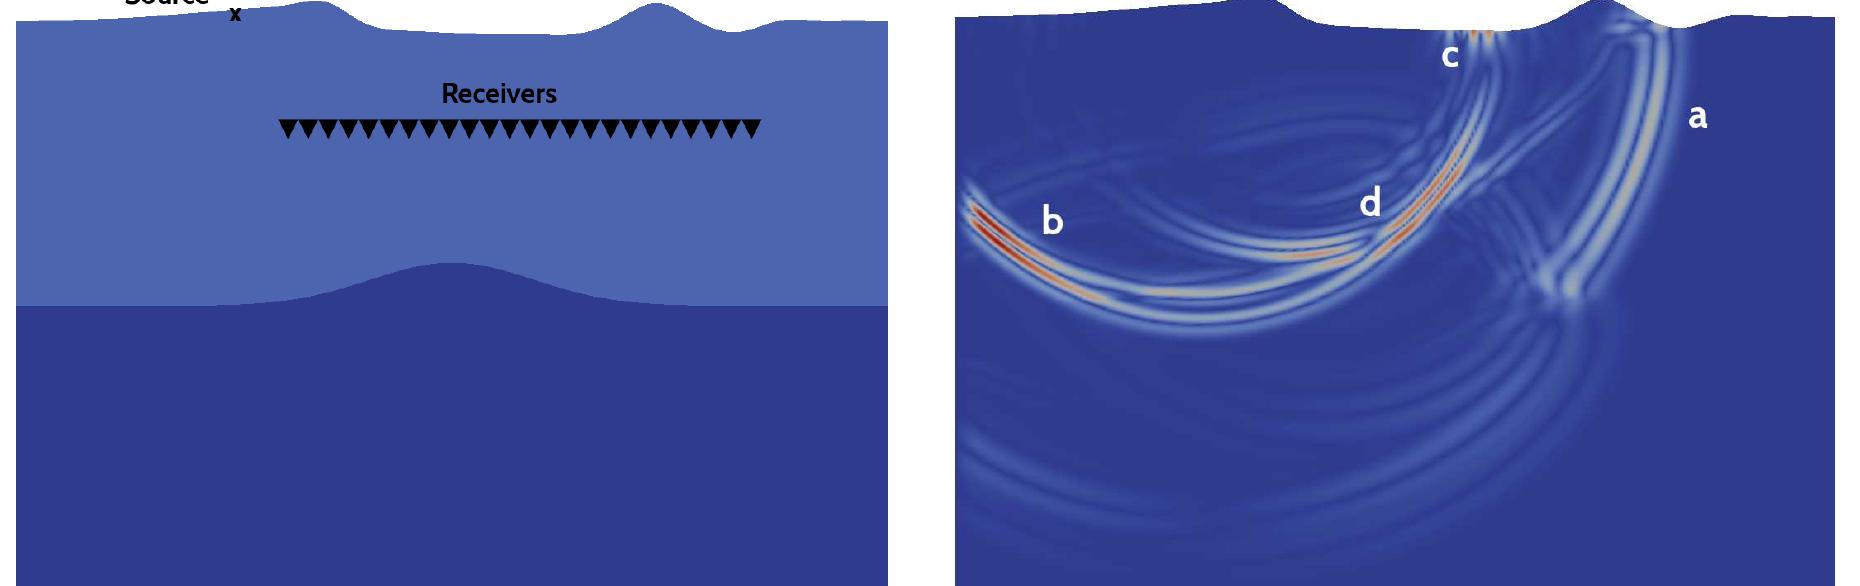
Figure 14 Upper left : test confiuration for the CG-SEM and HDG-SEM coupling. Upper right : snapshot of the velocity norm at time t = 1.5 sec. Lower left and right : velocity components recorded at the receiver located in the HDG domain. The amplified difference between the numerical solution and the CG-SEM reference solution is shown in blue. The difference remains small even after several wave transmissions across the coupling interface.