580 California St., Suite 400
San Francisco, CA, 94104

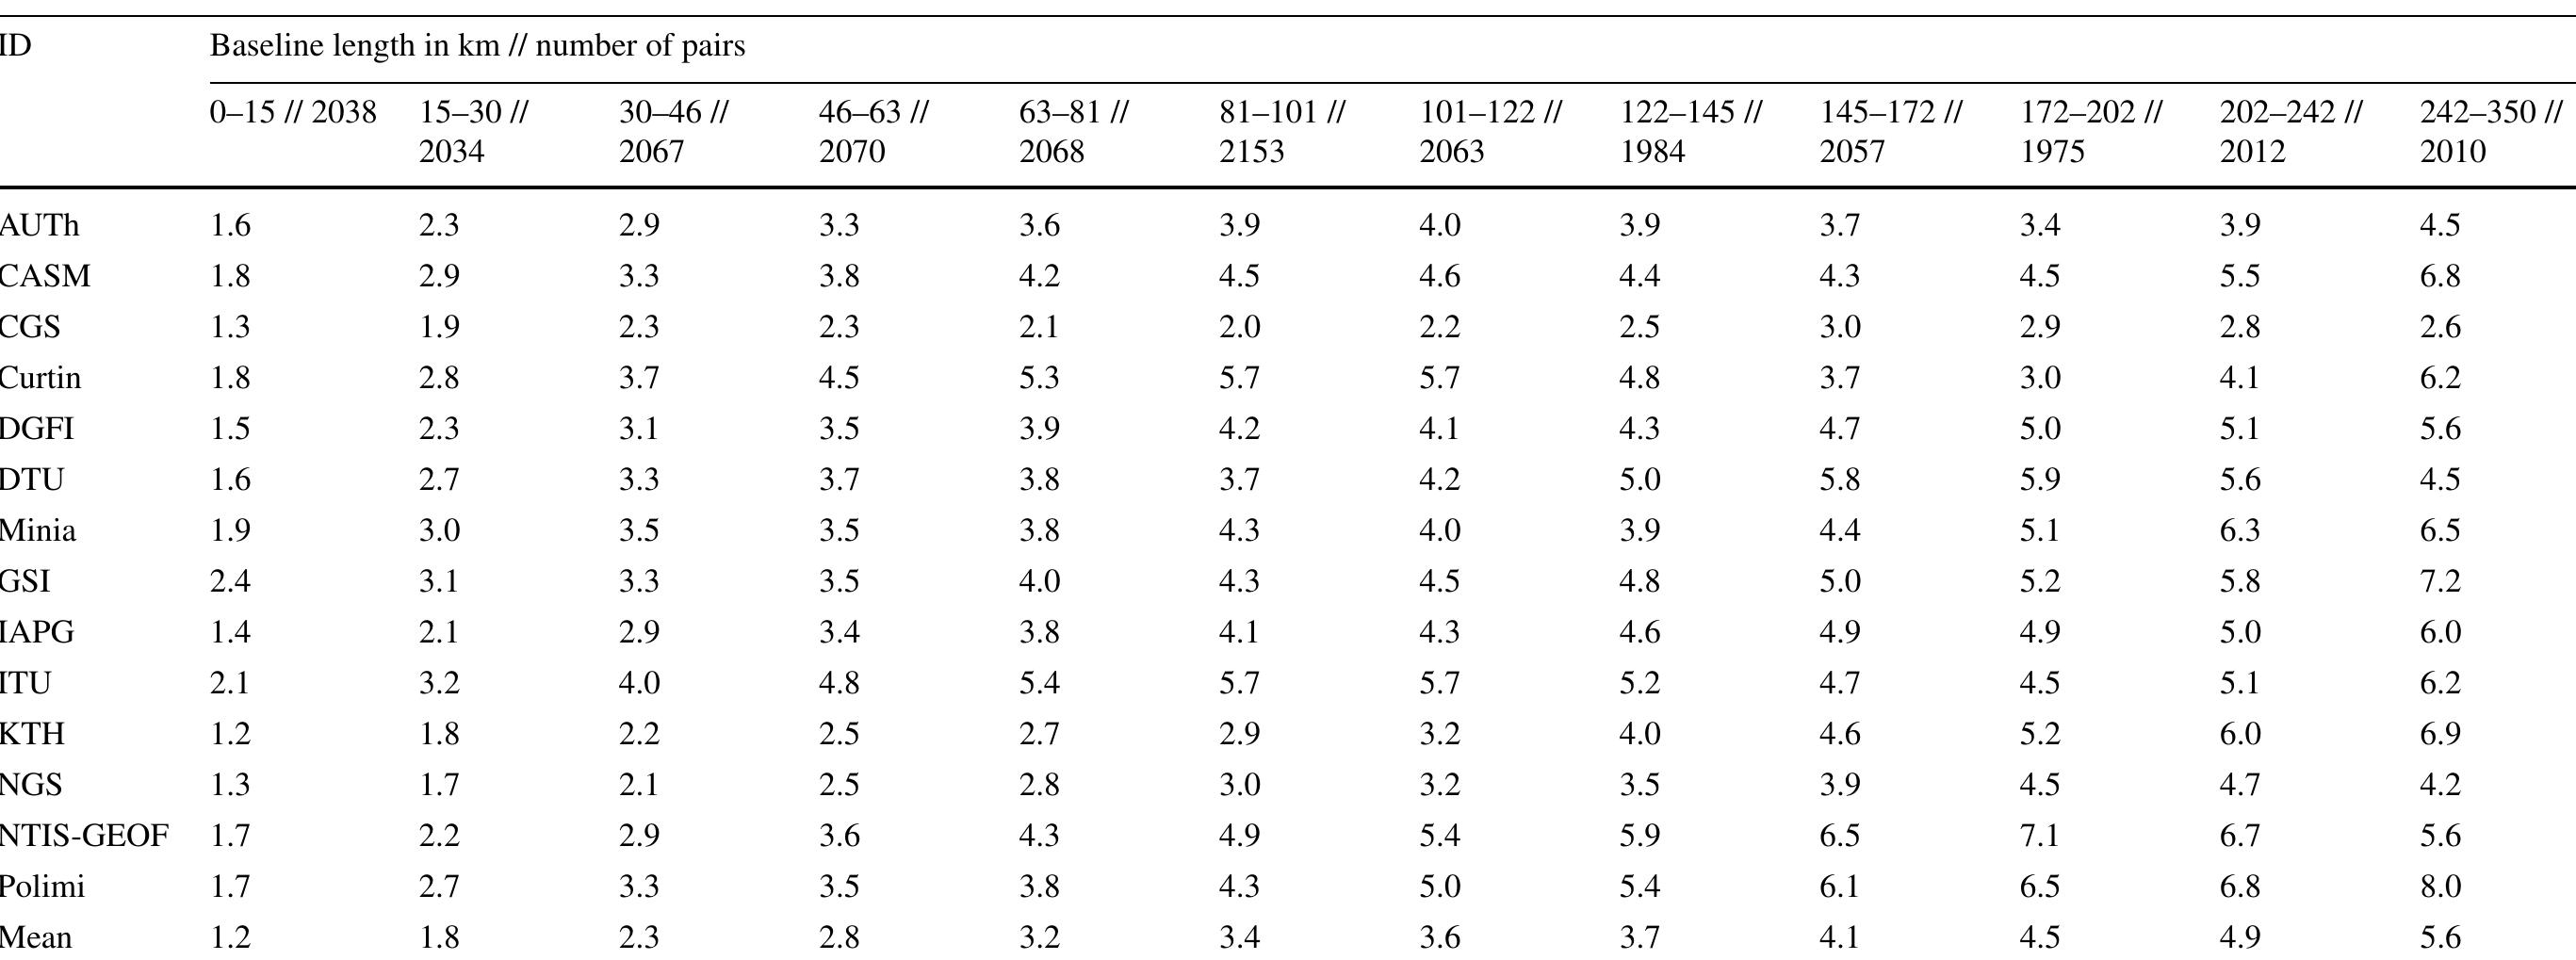
Figure 8 (2013), the 24,531 pairs were grouped into 12 bins, contain- ing approximately 2,000 pairs each. Then, the RMS values of height anomaly differences were computed for the 12 bins. The results are illustrated in Fig. 8. The five models in the best agreement are highlighted. The RMS values range from 2 to 3 cm for these five models at baseline lengths from 2 to 100 km, and then, they disagree up to 6 cm at longer baseline lengths. The CGS model presents RMS values between 2 and 3 cm in every baseline length.