Figure 3 – uploaded by RANIA FERAIHAN

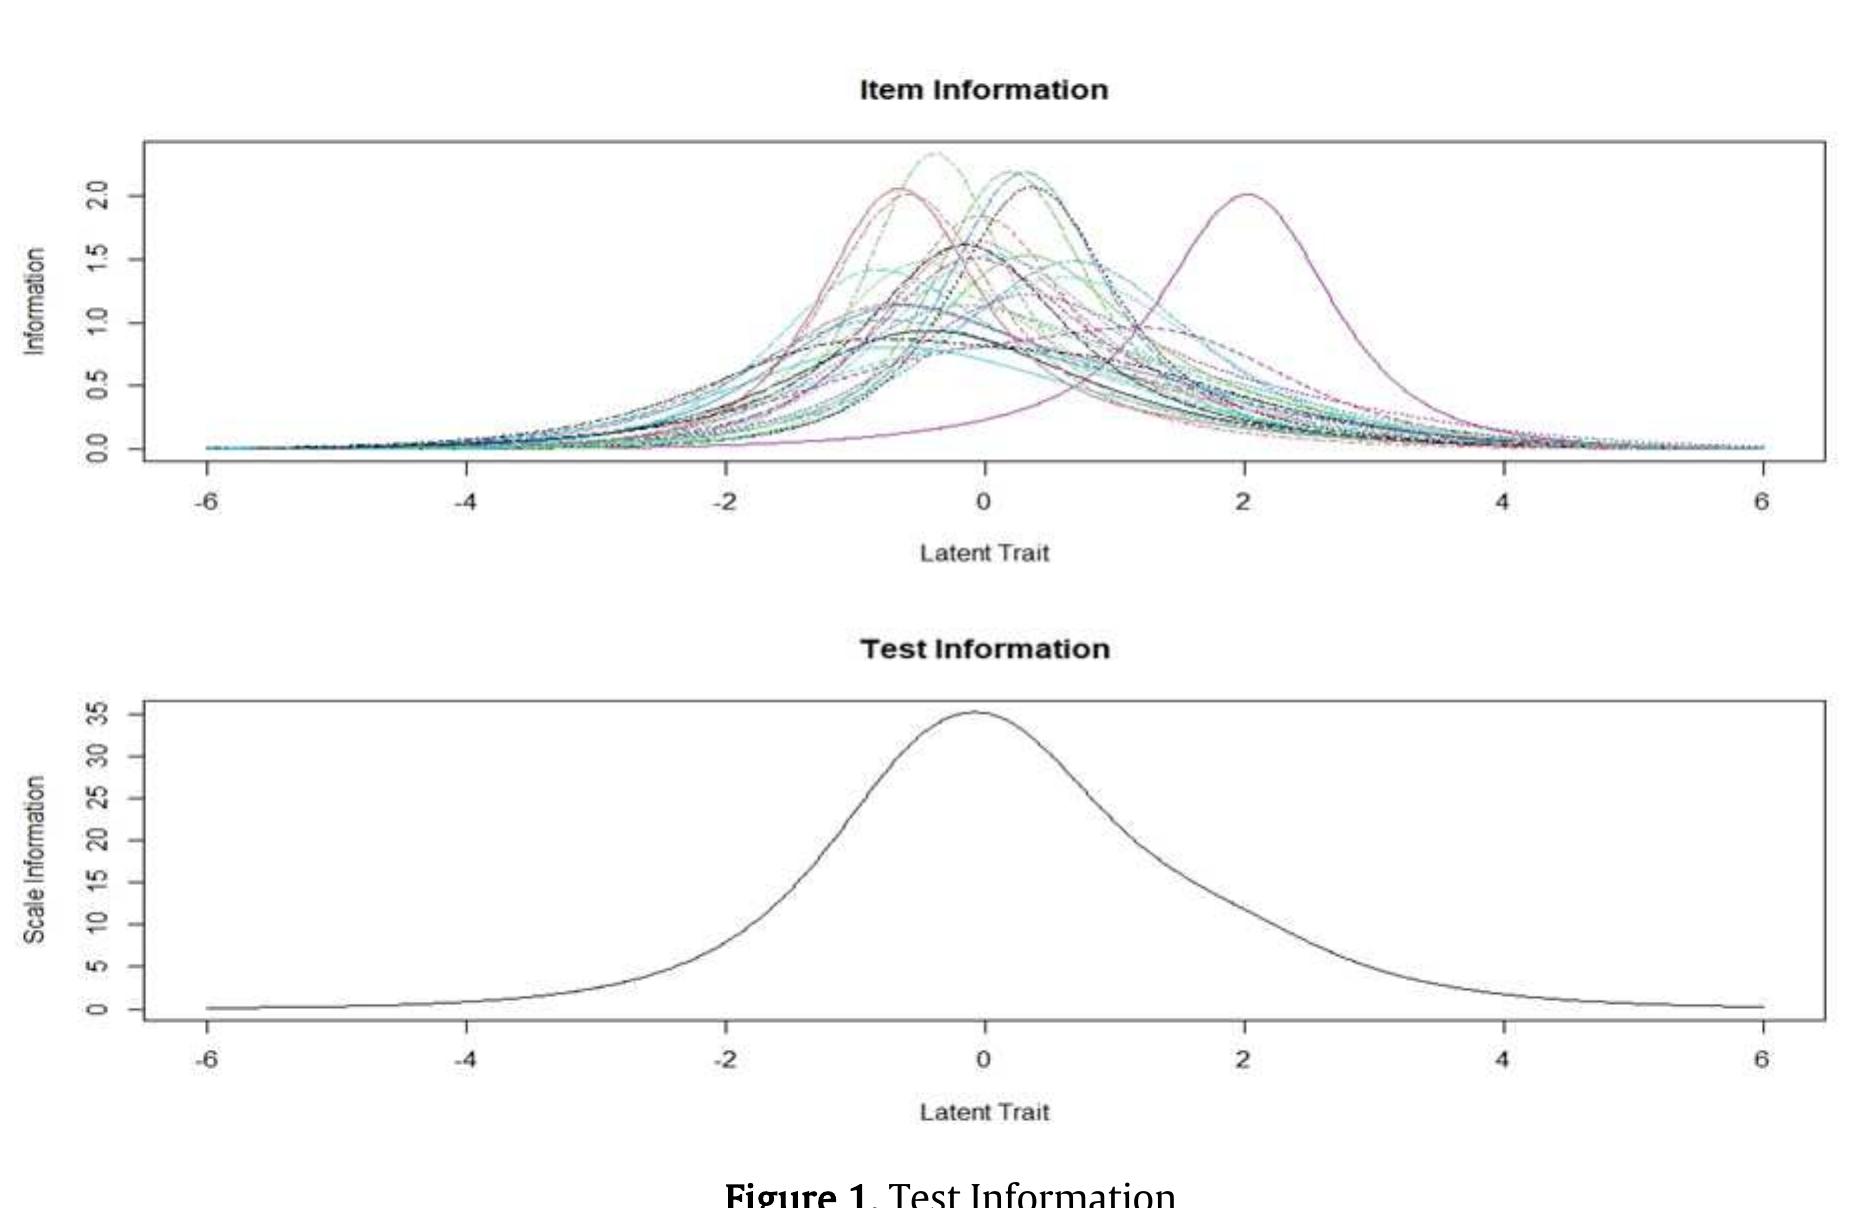
Figure 3 The Wright Map is usually used to describe the results of either dichotomous or polytomic responses based on the Rasch or IRT models. Wright's map image is used to see item difficulty or the level of problem difficulty with the distribution of the estimated ability (person's ability). From the picture above, the distribution of items is between -0.5 to 1.8, while the distribution of respondents’ abilities is 0 to 3. That means that respondents have high abilities, while the items on the measuring instrument measure people with moderate abilities. In simple terms, the tendency of respondents to choose the “strongly agrees” choice over the other answer choices.


