Table 1 Experimental observation yield of extracted mango pectin. Isolation and Screening of Pectinase Producing Fungi
Related Figures (4)
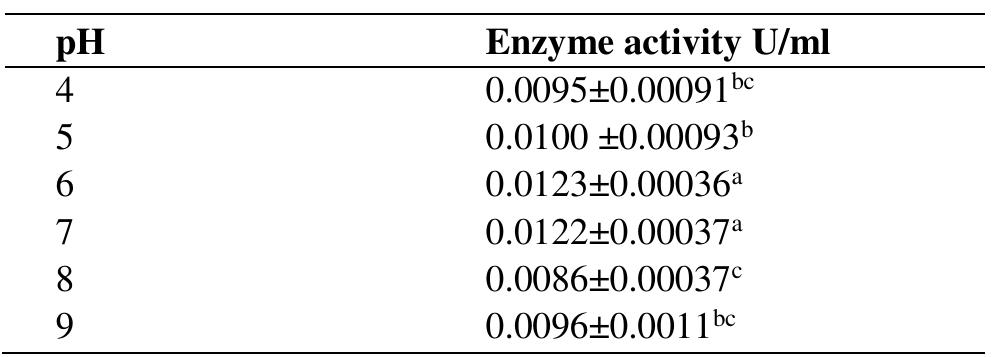
Table 2. Identification of pectinolytic fungal based on their colony morphology, growth characteristics, microscopic features and growth at temperature of 35 °C. Figure 1. Micrograph of pectinolytic fungal isolate (40X). Figure 2. Pectinase production by p2 versus substrate concentration. The effect of substrate concentration for pectinase production Pz was incubated at different concentration of mango pectin as 0.1, 0.2, 0.5, 1.0, 1.5 and 2% (Fig.2). Enzyme production increased with increase in concentration. A slight decrease in enzyme production was observed until the concentration reached 2%. The maximum 0.013109 U/mL enzyme production was observed at 1.5% of mango pectin. Determination of Optimum pH Required for Pectinase Production by P>. Table 5. Effect of pH pectinase production. SUMMARY AND CONCLUSIONS
Connect with 287M+ leading minds in your field
Discover breakthrough research and expand your academic network


