Inclusion in Netflix Original U . S . Scripted Series & Films
2021
Abstract
AI
AI
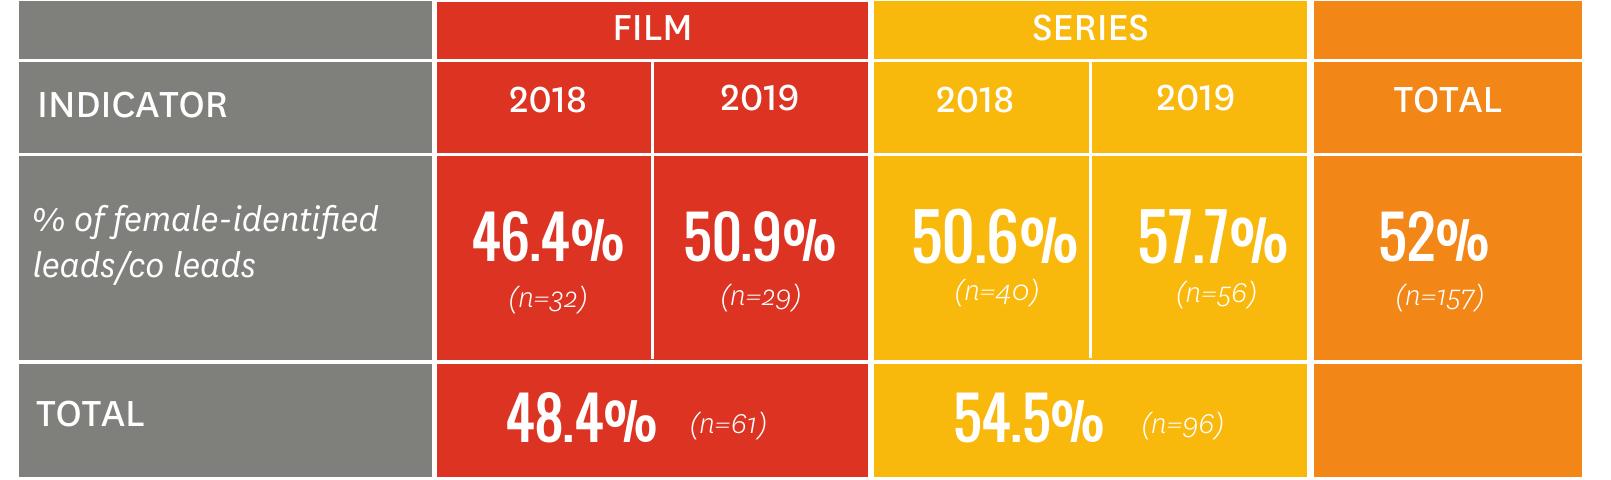
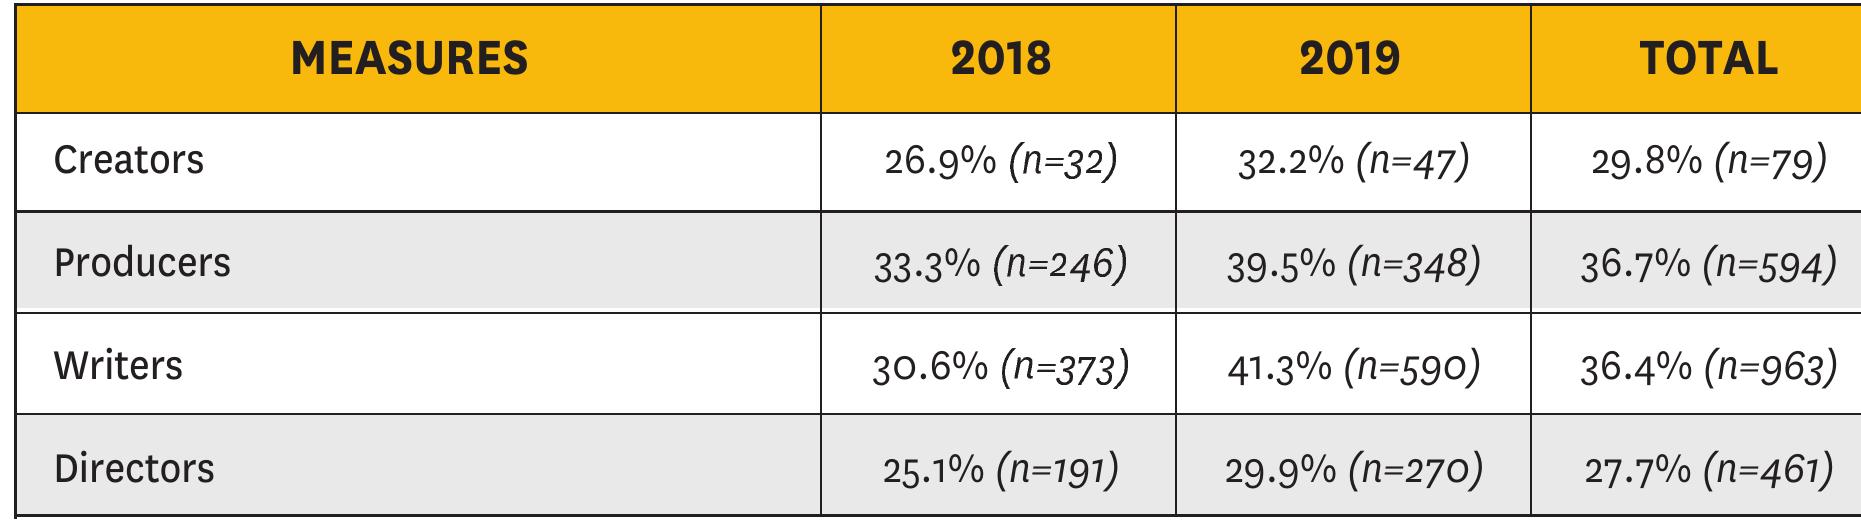
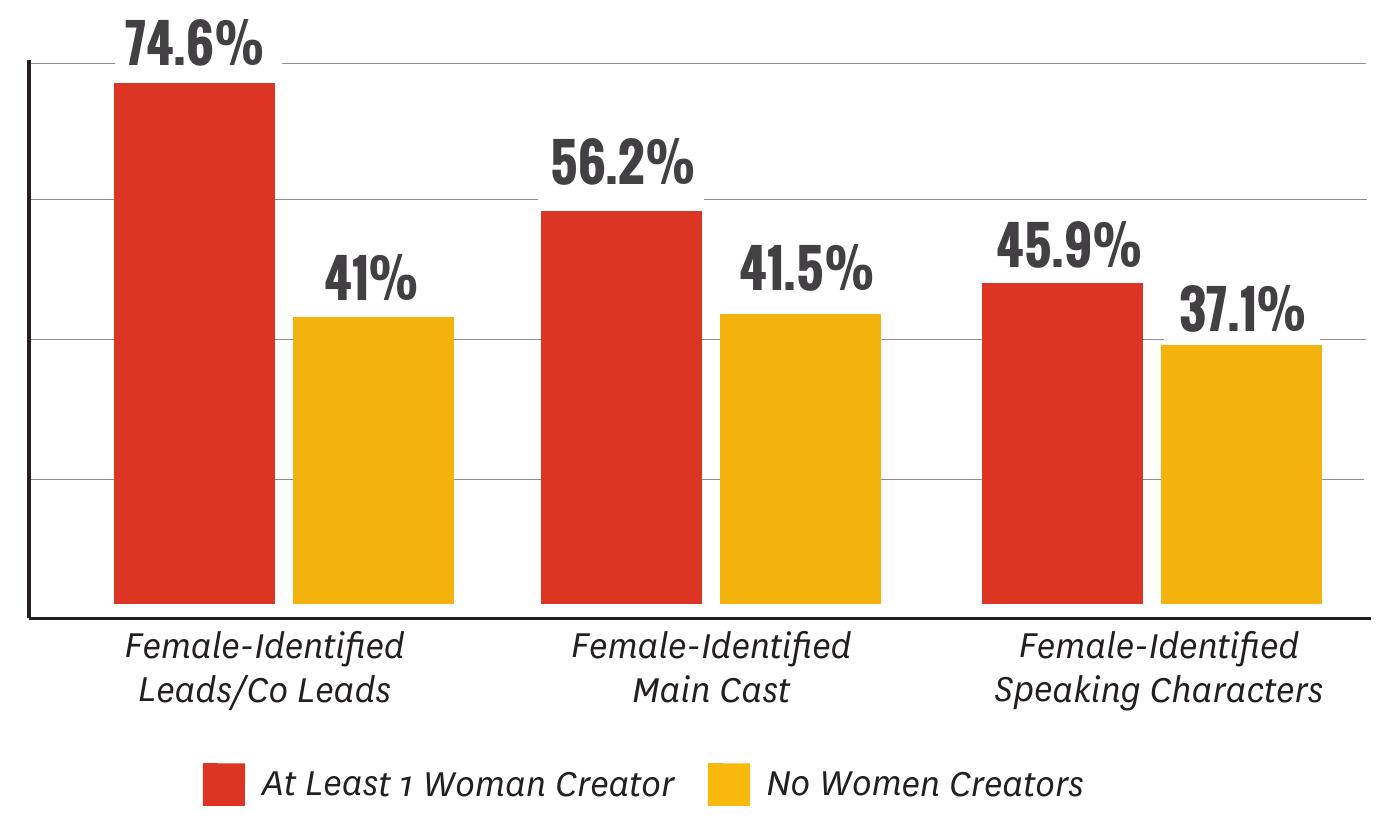
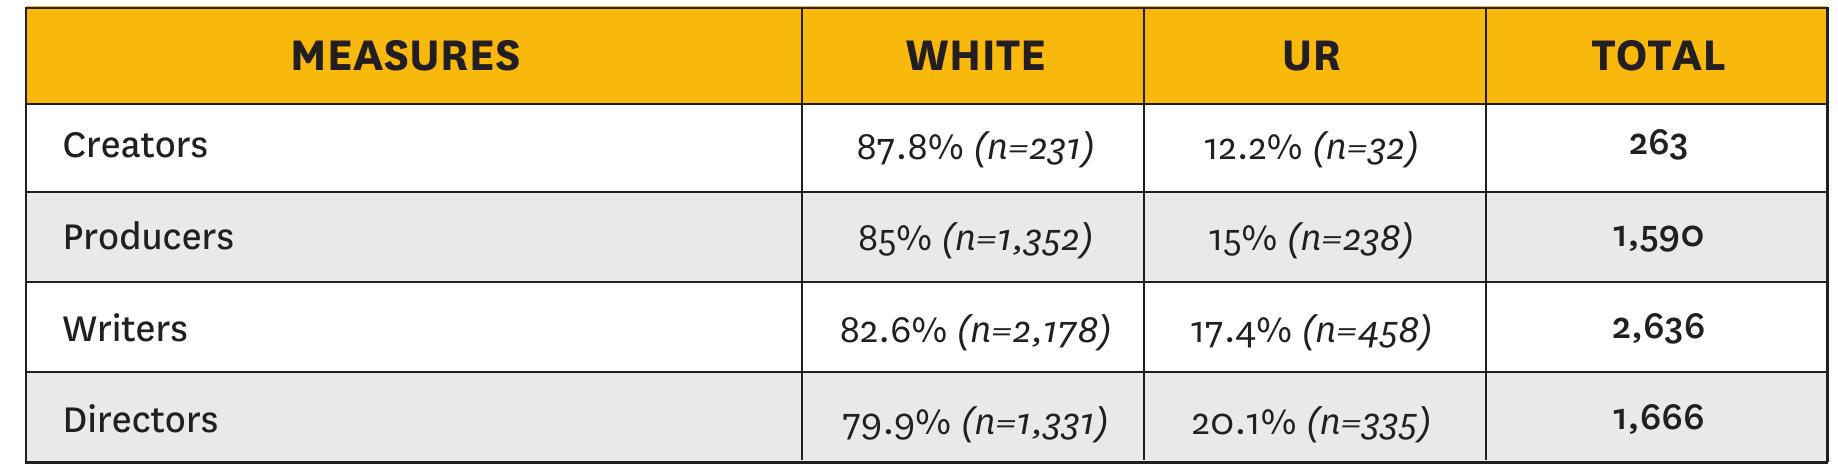
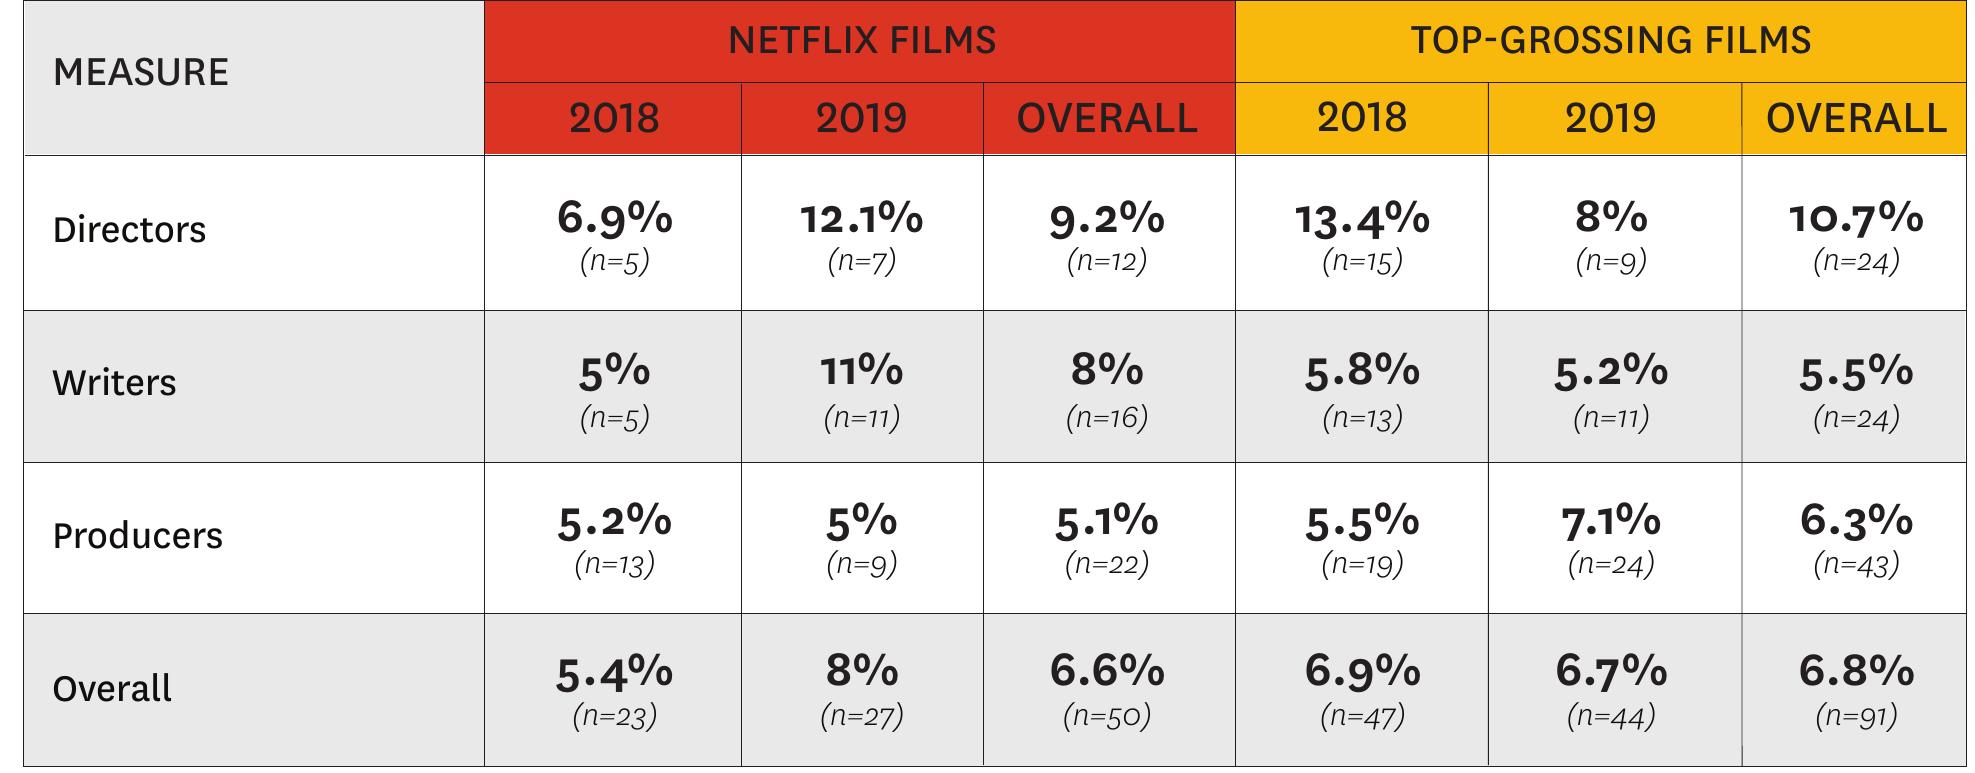
This paper provides an overview of inclusion in Netflix's U.S. original scripted films and series, focusing on gender, race/ethnicity, LGBTQ representation, and disability among both on-screen characters and behind-the-camera roles for the years 2018 and 2019. Analysis reveals that Netflix films and series featured a higher percentage of female leads and overall female representation compared to industry metrics, with significant year-on-year growth in female-driven storylines. Despite positive findings in gender representation, the inclusion of disabled characters remained critically low.
References (27)
- Yamina Al-Asadi Yasuko Yui Yuri Yim Zoily Mercado at-stake/arab-american-demographics-factsheet/
- U.S. Census Bureau (2020). Annual Estimates of the Resident Population by Sex, Age, Race, and Hispanic Origin for the United States: April 1, 2010 to July 1, 2019. Retrieved August 17th, 2020 from: https://www.census.gov/ newsroom/press-kits/2020/ population-estimates-detailed.html
- Some characters are not capable of possessing a race and/or ethnicity. That is, robots, supernatural creatures, or other non-human beings may be part of fictional storytelling. For those characters who were not capable of possessing a race and/or ethnicity, not applicable was used for this variable, and these individuals were excluded from analysis.
- The directors, writers, and producers for each film in the sample were col- lected via IMDbPro.com. For writing, only screenplay and screen story credits were included and writers of source material were not included. Across pro- ducer titles only 'Produced by' credits were taken for Netflix films. Gender and racial/ethnic information was obtained in the same method described above, using data obtained for other research at the Initiative and confirming with representatives and individuals when possible.
- Hunt, D., & Ramon, A-C. (2020). Hollywood Diversity Report 2020: A Tale of Two Hollywoods; Part 2: Television. UCLA College of Social Sciences. Avail- able: https://socialsciences.ucla.edu/wp-content/uploads/2020/10/UC- LA-Hollywood-Diversity-Report-2020-Television-10-22-2020.pdf
- Writers Guild of America (2020). WGAW Inclusion Report. Available: https://www.wga.org/uploadedfiles/the-guild/inclusion-and-equity/wgaw_ inclusion_report.pdf. Writers Guild of America (2019). WGAW Inclusion Re- port Card: 2017-2018 TV Staffing Season. https://www.wga.org/uploaded- files/the-guild/inclusion-and-equity/WGAW_Inclusion_Report_20.pdf.
- Hunt, D., & Ramon, A-C. (2020). Hollywood Diversity Report 2020: A Tale of Two Hollywoods; Part 2: Television. UCLA College of Social Sciences. Avail- able: https://socialsciences.ucla.edu/wp-content/uploads/2020/10/UC- LA-Hollywood-Diversity-Report-2020-Television-10-22-2020.pdf
- Directors Guild of America (2019, November 19). DGA Reports New In- clusion Records in the 2018-19 TV Season. Available: https://www.dga. org/News/PressReleases/2019/191119-Episodic-Television-Director-Div- ersity-Report.aspx.
- All individuals credited behind the scenes and main cast were researched to determine how they identify their racial/ethnic grouping. Online databases (Variety Insight, Studio System, IMDbPro) as well as press articles, interviews, familial information reported online, and direct communication were used to facilitate categorization. Measures were created counting the presence or absence of identification for each possible race and ethnicity category (e.g., Black-Identifying, present or absent).
- U.S. Census Bureau (2020). Annual Estimates of the Resident Population by Sex, Age, Race, and Hispanic Origin for the United States: April 1, 2010 to July 1, 2019. Retrieved August 17th, 2020 from: https://www.census.gov/ newsroom/press-kits/2020/ population-estimates-detailed.html
- U.S. Census Bureau (2020). Annual Estimates of the Resident Population by Sex, Age, Race, and Hispanic Origin for the United States: April 1, 2010 to July 1, 2019. Retrieved August 17th, 2020 from: https://www.census.gov/ newsroom/press-kits/2020/ population-estimates-detailed.html 30. Films with Black producers were more likely to feature Black Leads or Co Leads (86.7%, n=13) than films without a Black producer (12.6%, n=14). The same pattern held for main cast where films with one or more Black produc- ers included a larger proportion of main cast members that identified as Black (69%, n=78, vs. 14.8%, n=136, respectively).
- Noe-Bustamante, L. & Flores, A. (2019, September 16). Facts on Latinos in the U.S. Pew Research Center. Retrieved January 20th, 2021 from: https:// www.pewresearch.org/hispanic/fact-sheet/latinos-in-the-u-s-fact-sheet/
- U.S. Census Bureau (2020). Annual Estimates of the Resident Population by Sex, Age, Race, and Hispanic Origin for the United States: April 1, 2010 to July 1, 2019. Retrieved August 17th, 2020 from: https://www.census.gov/ newsroom/press-kits/2020/ population-estimates-detailed.html
- GLAAD (2017). Accelerating Acceptance. Retrieved January 20th, 2021 from: https://www.glaad.org/files/aa/2017_GLAAD_Accelerating_Accep- tance.pdf.
- GLAAD (2018). Where We Are on TV. Retrieved January 20th, 2021 from: https://glaad.org/files/WWAT/WWAT_GLAAD_2018-2019.pdf
- Flores, A.R., Herman, J.L., Gates, G.J., & Brown, T.N.T. (June 2016). How Many Adults Identify as Transgender in the United States? The Williams Insti- tute.
- While differences by medium were not significant, a few patterns can be noted. In film, the number of lesbian cast rose (2018: <1%, n=2; 2019: 2.1%, n=10), while the number of gay cast decreased (2018: 3.1%, n=17; 2019: 2.1%, n=10). There was little change in the number of bisexual cast (2018: <1%, n=2; 2019: <1%, n=3), and no transgender cast appeared in film. Moving to series, there were numerical increases for gay (2018: 2.2%, n=14; 2019: 3.4%, n=25) and bisexual (2018: <1%, n=4; 2019: 1.9%, n=14) cast, but little change for lesbian cast (2018: 1.8%, n=12; 2019: 1.7%, n=13).
- In film, a numeric increase occurred for lesbian characters (2018: <1%, n=12; 2019: <1%, n=18), while a decrease was witnessed for gay characters (2018: 1.2%, n=29; 2019: 1%, n=22). The number of bisexual (2018: <1%, n=5; 2019: <1%, n=4) and transgender characters (2018: <1%, n=1; 2019: <1%, n=2) varied little. In series, there were numeric increases across each group, as follows: lesbian (2018: <1%, n=25; 2019: 1.2%, n=46), gay (2018: 1.5%, n=50; 2019: 2.3%, n=91), bisexual (2018: <1%, n=7; 2019: <1%, n=17), and transgen- der (2018: <1%, n=2; 2019: <1%, n=10) characters.
- U.S. Census Bureau (2018). Americans with Disabilities: 2014. Retrieved January 20th, 2021 from: https://www.census.gov/library/publications/2018/ demo/p70-152.html. Americans with Disabilities Act (1990). https://www. ada.gov/pubs/adastatute08.htm. Characters were counted as having a dis- ability when the presence of a condition (rooted in the function, form, or structure of a character's mind and/or body) manifested a limitation, inter- ference, and/or non-functioning related to any 'major life activities' or 'ma- jor bodily function' for a period longer than six months. A disability could be present in one or more of the following domains: Communicative (seeing, hearing, speaking), Cognitive (learning, memory, thinking, emotions), and/or Physical (mobility, breathing, internal and external corporeal components).
- See Smith, S.L., Choueiti, M., & Pieper, K. (2016). Inequality in 800 Popular Films: Examining Portrayals of Gender, Race/Ethnicity, LGBT, and Disability from 2007-2015. Annenberg School for Communication & Journalism. Re- trieved from: https://annenberg.usc.edu/sites/default/files/2017/04/10/MD- SCI_Inequality_in_800_Films_FINAL.pdf
- U.S. Census Bureau (2018). Americans with Disabilities: 2014. Retrieved January 20th, 2021 from: https://www.census.gov/library/publications/2018/ demo/p70-152.html.
- U.S. Census Bureau (2018) reports include "any mental or emotional con- dition that seriously interfered with everyday activities" (p. 3) in their defini- tion of disability, noting that depression, anxiety, and other issues that result in "trouble coping with day-to-day stress" are included in this spectrum of conditions. Stories that featured characters coping with mental health issues that severely restricted their day to day activities were scrutinized to ensure that the restrictions experienced met the same threshold of restriction as other (e.g., physical, communicative) disabilities.
- GLAAD (2018). Where We Are on TV. Retrieved January 20th, 2021 from: https://glaad.org/files/WWAT/WWAT_GLAAD_2018-2019.pdf
- Myers, V. (2021, January 13). Inclusion Takes Root at Netflix: Our First Report. Netflix. Available: https://about.netflix.com/en/news/netflix-inclu- sion-report-2021