 Gabor Korvin
580 California St., Suite 400
San Francisco, CA, 94104
Academia.edu no longer supports Internet Explorer.
To browse Academia.edu and the wider internet faster and more securely, please take a few seconds to upgrade your browser.
AI
This research presents an analysis of seismic signals observed during explosions, focusing on the attenuation of waveforms as a function of distance from the source. The study details the methodologies used to sample and interpret the recorded data, emphasizing the variations in amplitude and pulse characteristics influenced by detection distance. Key findings include the identification of primary and ghost pulses and their collective spectral behavior, contributing to our understanding of seismic wave propagation in geological contexts.
1997
The design of a monitoring system for detecting explosions is a very topical problem, both for routine data processing at seismological observatories as well as for the monitoring of a Comprehensive Test Ban Treaty. In this framework it is desirable to have the possibility to quantify the presence of the isotropic component in the seismic source. For this purpose a method is presented, which is based on waveform inversion for the full moment tensor retrieval. The method inverts either full waveforms or separate seismic phases and returns the mechanism and time history of a point source. Moreover, it allows to redefine the hypocentral depth of the event and, in a simplistic way, to optimize the structural model as well. In order to model strong laterally heterogeneous structures, different pairs of structural models can be used for each source-receiver path. The source is decomposed into a volumetric part (V), representing an explosive or implosive component, and into a deviatoric part, containing both the double couple (DC) and the compensated linear vector dipole (CLVD) components. The method is applied to an area in central Switzerland and to the network of the Swiss Seismological Service. The events of interest include both earthquakes and explosions. Despite some modelling inadequacies of the source-time function, the explosions can be well identified with the inverted isotropic component in the source, as long as the number of stations used for the inversion is larger than three. The results of the inversion are better for large epicenter-station distances of the order of 40-90 km.
Reviews of Geophysics, 1970
The radiation field from explosions in a prestressed medium can be theoretically predicted on the basis of a dynamical theory of stress relaxation in the vicinity of the shock-induced fracture zone created by an explosion. The field consists of the normal compressional wave field resulting from the conversion of the shock wave to an elastic wave plus an anomalous part due to the release of strain energy. In this study we consider the nature of the radiation field to be expected from such a source in an inhomogenous earth and determine the stress , field required to explain the observations from a large underground explosion. The field is described in terms of radiation patterns as functions of frequency or alternately as the amplitude and phase spectrums at particular distances. These theoretical predictions are compared to the Love-and Rayleigh-wave radiation patterns and spectra from the nuclear explosion Bilby. Using the known source parameters, we obtain agreement between the observed radiation patterns and the predicted patterns for a pure shear prestress field equivalent to a shear couple oriented approximately N10øW. Using the amplitude spectrum of the observed field a,djusted for propagational effects, we find that the prestress was 70 4-20 bars in the source area. We conclude that this approach can be utilized as a means of systematically measuring the stress field of the earth. The term 'stress relaxation' will be used to describe the change in the stress field in a prestressed medium due to the creation of a rupture zone within The dynamics of the process can be formulated as an initial value problem [Archambeau, 1964, 1968, 1970]. In this study we will compare the predicted properties of the radiated field associated with stress relaxation to the seismic observations from an hnderground nuclear explosion. The objectives will be determine source parameters and the prestress field existing before the explosion and to verify some aspects of the theory. Most of the basic ideas involved in the formulation of this problem have been discussed previously. Press and Archambea.u [1962] considered the energy release to be expected from the formation of a rupture zone in a prestressed medium. The calculations were based on the ides that the maximum energy to be released as seismic radiation would be just the difference in the total strain , energy for the medium with and without a rupture zone. The model chosen was appropriate to an explosive-induced rupture, and the calculations showed that x Contribution 1611 from the California Institute of Technology. 473 474 ARCHAMBEAU AND $AMMI$ a very significant energy release could result when the model parameters were chosen to be close to those expected in realistic situations. When the theory was applied to the Ranier nuclear explosion, it was found that the initial strain field required for approximate agreement with the 5bservations was somewhat higher than 10-3. Though this seemed very high at the time, it has since been recognized that this level is quite reasonable for the low-rigidity•medium (tuff) in which the source was located. In the next section we will briefly review the energy calculation for the explosive rupture model, and in the process generalize it somewhat. We shall later apply these generalized energy relations, along with the dynamic field theory, to determine the rupture radius and prestress field in a specific application. After the initial energy calculations, Archambeau [1964, 1968] formulated the associated dynamical problem. That is, given a prestressed medium and assuming a growing surface within the medium on which the shear tractions vanish (or are reduced), one can ask what the radiated field will be. The problem was formulated as a generalized initial value problem, since the source of the radiated field is the relaxation of stress in the vicinity of the growing rupture boundary. This approach was used to predict the spectrum of the field at distances greater than several times the maximum dimension of the rupture surface with at least qualitative success. In particular, the radiation patterns and spectral characteristics predicted were in good first-order agreement with the observed properties of earthquake radiation fields. No systematic comparative study has been carried out, however, so that a detailed verification is lacking. In addition to models appropriate to earthquakes, the theory was used to predict the expected field from an explosion in a prestressed medium. Again qualitative agreement with observations from explosions at the Nevada test site was achieved from preliminary investigations [Archambeau, 1964]. Examples of the radiation patterns predicted by the theory for earthquakes and explosions in prestressed mediums are given in Figures 1, 2, and 3. We see that the field from an earthquake is generally more complex than that from an explosion. Specifically, the earthquake radiation patterns are frequency dependent, that is, the shape of the pattern changes with frequency, while that
Journal of Geophysical Research, 1971
The P-wave displacement spectra of the underground explosions Milrow and Longshot are compared with those of four shallow earthquakes of similar body-wave magnitude (m,) in the Aleutian Islands. The spectral data (0.5 _< T _< 33 sec) have been obtained from three vertical instruments at Pasadena, approximately 50 ø from the epicentral region common to the six events. A Novaya Zemlya explosion of comparable m, was also analyzed. The peak spectral amplitude for the earthquakes occurs at periods several times larger than for comparable m, explosions, indicating that the earthquakes have source dimensions several times larger than the explosions. For T < 1.5 sec, the spectra for both types of events are comparable; the absolute level and the rates of decay (o• -2) with increasing frequency are the same. The Q-corrected explosion spectra peak sharply in the interval 2 sec > T _> 1 sec and decrease at least as far as o• for longer periods. The earthquake spectra, however, continue to increase to a long-period level. The greatest differences in spectral amplitudes for the events considered occur at periods longer than 3 sec. The observed differences in the P-wave spectra provide a promising method for discriminating between earthquakes and underground explosions.
Shock Waves in Condensed Matter, 1986
This is a preprint of a paper intended for publication in a journal or proceedings. Since changes may be made before publicalion, this preprint is made available with the understanding that it will not be cited or reproduced without the permission of the **' author.
Journal of Physics of the Earth, 1992
Bulletin of The Seismological Society of America, 2001
In this article, we analyze the seismic wavefield produced by blasts fired at Mt. Vesuvius for a deep seismic sounding experiment and recorded by a dense short-period three-component seismic array. Seismograms from five explosions occurring at the bottom of wells located at different distances and azimuth with respect to the array site have been analyzed with the zero lag cross-correlation technique applied to both vertical and horizontal components in the frequency range 3-7 Hz. The aim is to analyze the portion of the seismograms long after the first P onset in order to obtain the slowness and backazimuth distribution of correlated secondary phases. Polarization analysis in time domain, carried out using the array covariance matrix technique, has also been applied to the well-correlated phases to determine their wave composition. Results show that the correlated phases detected in the coda of the seismogram shots are composed almost entirely of surface waves. Location of the scatterers shows a high concentration of the scatterers in and around the volcanic edifice of Mt. Vesuvius, confirming that topographical irregularities play an important role in the generation of the high-frequency scattering phenomena.
2020
Most equations used to predict the ground motion produced by explosions were developed using confined blasts that were detonated for breaking rock in mining or tunnelling. Ground motion is usually recorded by geophones or seismometers. The air blast produced by open-pit blasts and explosions on the surface can pose a significant risk, thus microphones and pressure gauges are often also used to monitor the effects of the explosion. The aim of this study is to determine whether the predictive equations developed for confined explosions can be used to predict the effects from explosions on the surface, with appropriate adjustments to the various coefficients. Three predictive equations developed for buried explosions were tested. The study shows that the US Bureau of Mines peak particle velocity (PPV) predictive equation is the most reliable. In addition, a predictive equation that uses the secondary atmospheric shock wave phenomenon also produced good results, and uses the scaled dela...
1974
Peak ground velocities as a function of distance for 45 the GREELEY nuclear blast at the Nevada 'Pest Site, 2'0 Dec. 1966. Tlic motion was recorded for the horizontal component of the Lg phase Peak ground 'velocities as a function of distance for 46 the DUMONT nuclear blast at the Nevada Test Site,
Applied Sciences
This article describes an approach of mathematical processing of signals (seismograms) from five blasthole charges from experimental blasting, each 3 m deep, with equal explosive weight (1 kg), and equidistant (3 m) from one other. The seismic explosive waves were measured at a 13 to 25 m distance. This article provides spectral analysis, wavelet analysis, and fractal analysis results. It defines the dependence of dominant frequency and amplitude on the distance to the blast center. According to the experimental data, the dominant frequency is calculated as y = 1.0262x0.2622 and the amplitude dependency as y = 18.139x−2.276. Furthermore, the analysis shows that 80% of the entire signal is concentrated in half the area of frequency range, i.e., the low frequency zone is of the most interest. This research defines the dependence of distance on the energy value of signal wavelet analysis. It is demonstrated that, according to the experimental data, the 12th frequency range is closely c...
Journal of Geophysical Research, 1971
Using data from high-gain seismographs operating in the deep (543-meter) mine observatory at Ogdensburg, New Jersey, we analyzed the excitation of long-period surface waves by earthquakes and underground explosions for four different regions of the world: western United States, the Aleutians, Novaya Zemlya, and Central Asia. The most important result of this study is that discrimination between earthquakes and underground explosions on an Ms-rs,, basis is enhanced when the amplitudes of Rayleigh waves with periods near 40 sec, rather than 20 sec, are used to determine M,. A discriminant based on surface waves with periods near 40 sec is particularly advantageous because of a very stable and pronounced minimum in earth noise in this period range. Love waves also yield a distinct separation between earthquakes and explosions on the basis of M, (Love) at 20 and 40 sec with mb and can be used for discrimination of small events for which no Rayleigh waves are recorded. The discrimination threshold at Ogdensburg is mb • •_ 3.8 for the western United States at a distance of about 30 ø and m• ___• 4.4 for the Aleutians at 70 ø. All the events studied could be discriminated by using 40-see Rayleigh waves. Amplitude spectra of Rayleigh waves in the period range 15 to 70 sec were computed for events in the western United States, the Novaya Zemlya region, and the Aleutians. The spectral amplitudes decrease more rapidly with increasing period for explosions than for earthquakes in the western United States and Novaya Zemlya. These spectral differences are consistent with an impulsive source time function for explosions. In t he Aleutians, however, the shape of the spectrum of long-period waves for the underground explosion Milrow is similar to spectral shapes for some, but not most, nearby earthquakes. Two plausible explanations for this spectral similarity are contamination of the Milrow spectrum by earthquake-generated Rayleigh waves, or the effects of focal depth and radiation pattern on the earthquake spectra.
T. BODOKY-G. KORVIN-I. LIPTAI-J. SIPOS*
The experiments were carried out in 1968 and 1969, in the Nyir-region, Hungary, in a nearsurface sandy complex characteristic of this area. The primary aim of the investigations was to determine the basic characteristics of the seismic pulse, its dependence on depth and charge weight, further its change during propagation. A detailed knowledge of these parameters has been rendered necessary by digital seismic data processing, where a realistic initial wave shape is indispensable for the deconvolution process.
A barium-titanate crystal was used as detector, for the measurements. The unitamplification matching member was mounted in a water-proof sonde-case holding the crystal. Signals from the crystal passed through this member to the recorder. The latter was a storage-system Textronix oscilloscope provided with a photoadapter.
The main data of the sensing head: material: BaTiO3 ceramics; diameter 20 mm ; natural frequency 500 kcps ; measuring range 0,1−100,0 atm; capacity 1670 pF ; sensitivity 230mV/atm; attenuating block: epoxiresin. The recording oscilloscope permitted the input signal to start the ray with an extremely short delay (1,6⋅10−7 sec ), to realize the amplification and time-expansion in calibrated stages, and to store the signal on the oscilloscope screen long enough to be photographed. The sensitivity of this oscilloscope hardly varies between 0 and 10 kcps . The calibration of amplitude and frequency is provided by an internal calibrating unit. Voltage limits: 1mV/div, resp. 300mV/ div peak to peak; time limits: 10−6 s/ div, resp. 1 s/ div, (LÁNYIRÁkóczy, 1969).
For the explosions, usual seismic hole-shooting with Paxit IV explosive was used. (Paxit IV is a mixture of trinitro-toluol, dinitro-toluol and ammon-saltpeter. Its parameters are similar to Nobel’s Explosive No. 704, Ammonal No. 3 and Blasting Abelite).
Partly to attain a better coupling, partly for the elimination of the effect of the low-velocity layer, the sensing sonde was placed, in general, in hole. When investigating the effect of the low-velocity layer, the sonde was placed on the bottom of the mud-pit, on the surface. Shots recorded in a hole are shown in Fig. 11, shots recorded on the surface, in Fig. 1.
Manuscript received 5, 5, 1971.

Fig. 1 Series of records observed at increasing source-detector distances (Cf. Table I, Rec. Nos. 5, 4, 3, 2, 1)
Puc. 1. Серия сигналов, записанных на дневной поверхности при увеличивающихся расстояниях до пункта возбуждения (см. табл. I. записи 5, 4, 3, 2, 1)
| Table 1. | List of records | ||||||
|---|---|---|---|---|---|---|---|
| Date | Charge weight, kg | Charge depth, m | Detector depth, m | Charge-detector horizontal distance, (m) | Charge-detector distance, m | Observation | |
| 1. | 1969 11 05 | 1 | 15 | 0.3 | 3.6 | 15.13 | on the surface |
| 2. | 1969 11 05 | 1 | 10.5 | 0.3 | 3.6 | 10.82 | on the surface |
| 3. | 1969 11 05 | 1 | 8.0 | 0.3 | 3.6 | 8.5 | on the surface |
| 4. | 1969 11 05 | 1 | 5 | 0.3 | 3.6 | 5.92 | on the surface |
| 5. | 1969 11 05 | 1 | 3 | 0.3 | 3.6 | 4.5 | on the surface |
| 6. | 1969 11 05 | 1 | 15 | 0.3 | 3.1 | 15.02 | on the surface |
| 7. | 1969 11 05 | 1 | 9 | 0.3 | 3.1 | 9.24 | on the surface |
| 8. | 1969 11 05 | 1 | 3.5 | 0.3 | 3.1 | 4.46 | on the surface |
| 9. | 1969 11 05 | 1 | 12 | 0.3 | 2.6 | 11.99 | on the surface |
| 10. | 1969 11 05 | 1 | 6 | 0.3 | 2.6 | 6.26 | on the surface |
| 11. | 1968 10 10 | 1 | 10 | 10 | 10 | 10.0 | in hole |
| 12. | 1968 10 10 | 1 | 15 | 10 | 10 | 11.18 | in hole |
| 13. | 1968 10 10 | 1 | 30 | 10 | 10 | 22.36 | in hole |
| 14. | 1968 10 10 | 1 | 40 | 10 | 10 | 31.62 | in hole |
| 15. | 1968 10 10 | 1 | 50 | 10 | 10 | 41.23 | in hole |
| 16. | 1968 10 10 | 1 | 20 | 0 | 10 | 22.36 | in hole |
| 17. | 1969 04 24 | 0.125 | 15 | 12 | 17 | 17.26 | in hole |
| 18. | 1969 04 23 | 0.25 | 15 | 12 | 16 | 16.28 | in hole |
| 19. | 1969 04 23 | 0.5 | 15 | 12 | 16 | 16.28 | in hole |
| 20. | 1969 04 23 | 1 | 15 | 12 | 17 | 17.26 | in hole |
| 21. | 1969 04 24 | 2 | 15 | 12 | 17 | 17.26 | in hole |
| 22. | 1969 04 24 | 4 | 15 | 12 | 17 | 17.26 | in hole |
| 23. | 1969 04 24 | 1 | 10 | 0 | 1 | 10.05 | in hole |
Records were sampled manually at equidistant rates Δt=0,0002sec, resp. Δt=0,00025sec. The computations were performed with a MINSK-2 computer. The beginning of the analysed interval of the pulse was the first onset of the pressure wave and the end of the interval was identical with the end of the first period.
The computer program determined for each pulse:
a) the pulse-shape, reduced to zero average and normalized with respect to the amplification used;
b) the minimum and maximum amplitude ( Amin and Amax ), the time interval between them (T1), the pulse width (T), and the average energy of the pulse (Fig. 2).
The spectrum was computed with the well-known formula of the transfer function of digital filters (Robinson-Treitel, 1964).
23 records were analysed altogether (Table I). In case of ghosts the primary pulse and its ghost were analysed separately as well as the composite wave-form.

Fig. 2 Characteristics of the primary pulse
2. ábra. A jelalak jellemzői
Pис. 2. Характеристики формы сигналов
The following relations were analysed:
The results of analysis will be compared with already published theoretical and experimental data, and discrepancies will be tried to be explained. Pulses observed on the surface and those observed in hole will be separately treated, since they show rather different properties, due to the filtering effect of the weathered layer.
Pulse amplitudes, when observed on the surface, decreased with increasing shot-detector distance, according to the law
Amin= const. r−1Amax= const. r−1,1
The results apply to a distance interval r=4,5−15 m and a ccnstant charie weight W=1 kg (Fig. 3.a). The series, recorded in hole, showed a significant, although not regular, decrease.
The average energy was found to depend on distance as
E= const. r−2,32
when measured on the surface. The hole measurements gave
E= const. r−2,02
(Fig. 3.b)
There is a considerable discrepancy among experimental data published on amplitude decrease (Table II). The relatively small exponent found is closest to that observed in water (Grinda, 1959; Lányi-Rákóczy, 1969). This is due to the small range of distances considered. Indeed, the law E∼r−2,32, describing the decrease of energy in the weathered layer, can be written as E∼r−2⋅r−0,32, where the first factor describes spherical divergence, while the second corresponds to absorption, since, in the range of distances in question, r−0,32≈e−2αr with α=0,14 m−1 being the

Fig. 3 Amplitude (a) and average energy (b) values observed on the surface, as functions of distance
3. ábra. Felszinen mért amplitúdó (a) ill. átlagenergia (b) értékek a távolság függvényében, állandó töltetsúly mellett
Pис. 3. Зависимость амплитулы (a) и средней интенсивности (б) от расстояния, при равных величинах заряда
| Author | Year | Medium | Range of distance, m | Exponent of divergence | Relation |
|--------|------|--------|----------------|---------------|-----------------|--------|
| 1. Ricker | 1953 | clay | 15 – 488 | -2.5 ± 3% | A ~ tº |
| 2. Jolly | 1953 | clay | 50 – 152 | -2.6 | A ~ tº |
| 3. Levin-Lynn | 1958 | — | 30 – 150 | -2.26 ± -2.38 | A ~ tº |
| 4. McDonal et al. | 1958 | — | 1.5 – 5.1 | -1.98 ± -2.26 | A ~ tº |
| 5. Duvall | 1953 | sandy clay resp. granite | 1.5 – 5.1 | -1.6 ± -2.5 | A ~ tº |
| 6. Grinda | 1959 | water | 0.7 – 32 | -1.13 | A ~ tº |
| 7. Fogelson et al. | 1959 | granite gneiss | 0.7 – 32 | -1 | A ~ tº |
| 8. Kogan | 1961 | — | r larg | -2 | A ~ tº |
| 9. Lányi-Rákóczy | 1969 | water | 50 – 840 | -0.9727 | A ~ tº |
| 10. O’Brien | 1969 | clay | 3 – 80 | -1.01 ± -1.66 | A ~ tº |
| 11. O’Brien | 1969 | sandstone | 3 – 80 | -1.14 ± -1.69 | A ~ tº |
**Dependence of energy on distance**
| Author | Year | Medium | Range of distance, m |
|---|---|---|---|
| 12. Howell-Kaukonen | 1954 | — | 3.08 – 357 |
| 13. Howell, Jr.-Budenstein | 1955 | — | 3.08 – 357 |
| 14. Fogelson et al. | 1959 | granite gneiss | 0.7 – 32 |
absorption coefficient for the dominant frequency of the pulse. It is a general experience that for greater distances the exponent increases, owing to energy losses in reflection, absorption and scattering phenomena.
The pulse width T and the time interval T1 between amplitude minimum and amplitude maximum increases during propagation according to the laws
T= const. r0,24T1= const. r0,35
(detector on surface) and
T= const. r0,42T= const. r0,80
(detector in hole; Fig. 4). The results obtained are in conformity with literary data:
T= const. t0,5 (Ricker, 1953), T= const. r0,37−0,16 (O’Brien, 1969), T= const. t0,25 (McDonal et al., 1958).
Each pulse was Fourier-analysed between 0−1000cps. The computed spectra can be considered as reliable between 10−300cps (below 10 cps the spectrum is distorted by the shortness of records, while above 300 cps it becomes noisy due to reading errors).
It was assumed that the detector’s transfer function is not influenced by its orientation and that the initial spectrum of the explosion does not depend on source depth. Fig. 5 shows the spectra of records observed at different source-detector distances. The analysis of these spectra have led to the following conclusions:
From inspecting the spectra of pulses recorded on the surface it is apparent that the total spectral energy decreases with increasing source-detector distance and the dominant frequency shifts toward the lower range during propagation. The decrease of spectral energy can be attributed to the combined effect of spherical divergence and absorption, while frequency shift is due to a frequency-dependent mechanism of the latter. One among the spectra shown in Fig. 5a has a unique shape, it looks like the spectrum of two interfering wavelets. The corresponding record was made above the ground-water table.
Fig. 5b shows spectra of the pulses recorded in hole. The same shift of frequencies can be observed again, the decrease of energy, however, is not so unambiguous, since in these measurements the explosions were performed under slightly different conditions. The spectrum of Rec. No 6 in this series corresponds to an explosion at the same depth but recorded on the surface. It gives, correspondingly, the transfer function of the weathered layer. The weathered layer behaves as a low-pass filter with 90 cps cut-off frequency and 12 dB/ octave slope, approximately.

Fig. 4 Pulse width © and time difference between minimum and maximum amplitudes (x), as functions of distance. Recorded on the surface (a), and in hole (b)
4. ábra. Jelszélesség © illetve maximum-minimum távolság ( x ) a megtett út függvényében a - felszínen; b - lyukban észlelve
Рис. 4. Зависимость ширины ( e ) и разноса экстремумов сигнала ( x ) от пути пробега, при a - наземных; δ - скважинных наблюдениях
The dominant frequency decreases with increasing source-detector distances, in the order of r−1/3 (measured on the surface) and r−2/3 (measured in hole). The small deviation from the law describing pulse-broadening is due to the fact that for pulses of not exactly sinusoidal shape, the relation T=1/fpeak is only approximately valid.
A frequency-dependent absorption coefficient was determined from the computed spectra of the pulses. We assume that these spectra can be written as
Y(ω)=R(ω)⋅S(ω)⋅X(r,ω)⋅r−1
where R(ω) the source spectrum
S(ω) amplitude characteristics of the detector
X(r,ω) attenuation of a harmonic component of angular frequency ω=2πf, after a path of length r.
Let us assume, further, that
X(r1+r2;ω)=X(r1,ω)⋅X(r2,ω)X(r,0)=1
Eq. (2) expresses the homogeneity of the medium and prescribes the usual normalizing constraint. The solution for the functional equation (2) is given by
X(r,ω)=e−α(ω)r,α(0)=0
where α(ω) is some non-negative function of frequency called the (frequency-dependent) absorption coefficient.

Fig. 5 Amplitude spectra of pulses for different source-detector distances. a. Observation on the surface; source-detector distance: 115.13 m,210.82 m,38.5 m,45.92 m,54.5 m; b. Observation in hole; source-detector distance: 110 m,211.18 m,322.36 m,431.62 m, 541.23 m,622.36 m
5. ábra. Jelek amplitúdó-spekrumai különbözö töltet-szonda-távolság esetén, állandó töltetsúly mellett a) felszínen észlelve; töltet-szonda-távolság: 1−15,13 m;2−10,82 m;3−8,5 m;4−5,92 m;5−4,5 m. b) lyukban észlelve; töltet-szonda-távolság: 1−10 m;2−11,18 m;3−22,36 m;4−31,62 m;5−41,23 m;6−22,36 m
Рис. 5. Амплитудные спектры сигналов при различных расстояниях до пункта возбуждения и равных величинах заряда
a) наземные наблюдения при расстояниях до пункта возбуждения: 1−15,13 m;2−10,82 m; 3−8,5 m;4−5,92 m;5−4,5 m;
д) скважинные наблюдения при расстояниях до пункта возбуждения: 1−10 m;2−11,18 m; 3−22,36 m;4−31,62 m;5−41,23 m;6−22,36 m
Using spectra of pulses recorded at different distances r1 and r2 from the source, the detector’s transfer function S(ω) can be eliminated and, assuming that R(ω) is independent of shot depth, the absorption coefficient can be determined.
In conformity with published theoretical and experimental findings it was found that α obeys the law
α(ω)= const. ωn
where, in our case, n=2 for the weathered layer, the attenuation being
2,3⋅10−5f2 dB/m
while measurements performed in hole gave a smaller value n=1,2 (Fig. 6). Exponent n=1,2 is close to the values usually encountered in literature (Table III), while the f2 law, describing attenuation in the weathered layer, reproduces Ricker’s classic, much debated, result.

Fig. 6 Coefficient of absorption in function of frequency, a in hole, b on the surface 6. ábra. Abszorpciós koefficiens a frekvencia függvényében, a - lyukban, b - felszinen észlelve
Рис. 6. Зависимость коэффициента поглощения от частоты при a - скважинных; ∂ - наземных наблюдениях
| Table III. | Dependence of absorption on frequency | |||||
|---|---|---|---|---|---|---|
| Author | Year | Medium | Range of frequency, cps | Law of absorption | ||
| 1. Born | 1941 | 22 – 48 | e⁻ᵃᵈʳᴇ | δ = 0.023 ± 0.041 | ||
| 2. Rieker | 1953 | e⁻ᵃᵉʳᴇ | α = α₁²/₁₀ | |||
| 3. Karusz | 1958 | sandy clay | 80 resp. 200 | e⁻ᵃᵉʳᴇ | α = 0.19/m resp. | |
| α = 0.67/m | ||||||
| 4. McDonal et al. | 1958 | 50 – 450 | α = 0.65 f¹.¹ dB/1000 ft = | |||
| = 2.13·10⁻⁴ f¹.¹ dB/m | ||||||
| 5. Huang Jen-Hu | 1961 | clay, sand | 20 – 80 | e⁻ᵃᵉʳᴇ | α = α₁²/₁₀ | |
| = 7.8·10⁻³/Hz | ||||||
| 6. Attewell-Ramana | 1966 | 1 – 10⁸ | α = 1.012·10⁻³·f⁰.⁸¹¹ dB/cm | |||
| α = α₁²/₁₀ | ||||||
| 7. Mack | 1966 | sandy clay | e⁻ᵃᵈʳᴇ | α = α₁²/₁₀ | ||
| where | ||||||
| 1 | ||||||
| 8. Tullos-Reid | 1969 | e⁻ᵃᵈʳᴇ |
In this series of experiments the charge weight varied from 1/8 to 4 kg , the detector was placed in holes at a constant distance r=17 m from the source. The following relations were established:
amplitude vs. charge-weight dependence:
Amin= const. W0,54;
energy vs. charge-weight dependence:
E= const. W1,07.
These relations are illustrated on Fig. 7.

Fig. 7 Amplitude (a) and average energy (b) values measured in hole, in function of charge weight, for constant source-detector distance
7. ábra. Lyukban mért amplitúdó (a) illetve átlagenergia (b) értékek a töltetsúly függvényében, állandó töltet-szonda-távolság mellett
Puc. 7. Зависимость величин амплитуд (a) и интенсивности (d) от величины заряда при постоянных расстояниях зонда до пункта возбуждения, при скважинных наблюдениях
The literature concerning amplitude vs. charge weight relations unanimously accepts the A= const. Wn law. The exponent n, however, greatly depends on the explosion itself (charge weight, shape and quality of explosive, properties of the surrounding medium, etc.), so a variety of values covering the range n=0,33−1,2 have been reported (Table IV). The exponent found by us is close to that of O’Brien, 1969 .
Pulse width T was found to increase with the 0,13 th power of charge weight (see also O’Brien, 1969). T1 showed no significant change (Fig. 8).

Fig. 8 Pulse width in function of charge-weight
8. ábra. Jelszélesség a töltetsúly függvényében
Puc. 8. Зависимость ширины сигнала от величины заряла
Fig. 9 illustrates the spectra corresponding to different ( 1/8−2 kg ) charge weights in a constant depth, recorded at a constant distance ( r=17 m ) from the source. From the analysis of these spectra one may draw the following conclusions:
By increasing the weight of charge the pulse spectrum shifts toward lower frequencies.
| Table IV. | Dependence of amplitude on charge weight | ||||
|---|---|---|---|---|---|
| Author | Year | Medium | Range of charge weight, kg | Exponent | Remark |
| 1. Barnhard | 1967 | 1/3, 1/2, 2/3, 3/4, 5/6, 1, 7/6 | data collected from literature | ||
| 2. Habberjam-Whetten | 1952 | 2 – 90 | 0.805 | ||
| 3. Gaskell | 1956 | sandstone | 9 – 90 | 1.11 | |
| 4. O’Brien | 1957 | 1 – 136 | 1.12 | ||
| 5. O’Brien | 1960 | 1 – 200 | 2/3 | ||
| 6. Lányi-Rákóczy | 1969 | water | 0.2 – 30 | 0.3294 | |
| 7. O’Brien | 1969 | clay | 0.8 – 9.5 | 0.336 – 0.55 | |
| 8. O’Brien | 1969 | sandstone | 0.8 – 9.5 | 0.38 – 0.56 |
According to Peet’s (1960) theory the peak values of the spectra vs. frequency, in case of different charges are located on a hyperbola Apeak = const. f−2. We found Apcek = const. f−0,85, the smaller exponent can be attributed to the low-pass character of the weathered layer (cf. Peet, 1960, Section IV).

Fig. 9 Amplitude-spectra of pulses for different charge weights (source-detector distance constant)
9. ábra. Jelek amplitúdó-spektrumai különbözö töltet-súlyok esetén, állandó töltet-szonda-távolság mellett
Puc. 9. Амплитудные спектры сигналов при разных величинах заряда и равных расстояниях между зондом и зарядом
The dominant frequency was found to depend on charge weight as fpcek = = const. W−0,09 (Fig. 10). A recent paper of Schenk (1971) lists experimental and literary data ranging from n=0,12 to n=0,28. It is of interest to note that all experimental values hitherto reported are lower than the theoretical exponent, n=1/3 (Peet, 1960; Blake, 1952) which would correspond to the equivalent radiator hypothesis. The spectral amplitude corresponding to dominant frequencies was found to be proportional with W0,5. According to Peet (1960) the theoretical exponent is 2/3.

Fig. 10 The dominant frequency in function of charge weight
10. ábra. Csúcsfrekvencia a töltetsúly függvényében
Puc. 10. Зависимость предельных частот от величины заряда
On certain records (Nos. 11-16, in Table I) the primary pulse was followed by a ghost-arrival. Typical records are shown in Fig. 11.
Figure 12 illustrates the geometry involved in searching for the surface which generates ghosts. From this figure it is obvious that
v⋅tp=(hz−hd)2+d2v⋅tg=(hz−2hg+hd)2+d2
where we have introduced the notations
hg depth of the ghost-generating surface,
hd detector depth,
hz shot depth,
d horizontal source-detector distance,
v average velocity,
tp,tg primary and ghost arrival times, respectively.
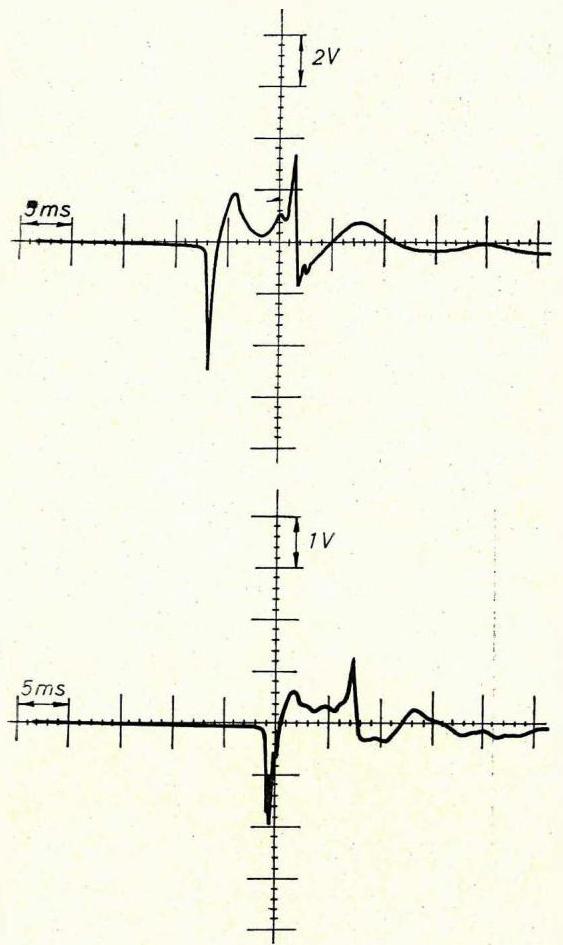
Fig. 11 Typical ghost arrivals
11. ábra. Ghostos felvételek
Puc. 11. Записи с отражениями-спутниками

Fig. 12 The geometry of ghost generation
12. ábra. Ghostképződés geometriája
Puc. 12. Геометрия сбразования отражений-спутников
Using observed values of tg and tp, the unknown depth hg of the surface can be determined. Calculations gave the fair estimation hg=3−6 m, suggesting that ghost pulses originate from top of the ground-water table. In order to check this hypothesis in another way, we computed the angle of incidence Θ of the ghosts and estimated the corresponding reflection coefficients from the ghost/primary amplitude ratios. The plot of reflection coefficient versus angle of incidence is illustrated in Figure 13. Extrapolating for the case of normal incidence, that is, for Θ=0, a reflection coefficient −0,45 is obtained which seems to be realistic for a moist clayey sand-dry sand boundary. Indeed, denoting the acoustic impedances of dry sand and moist clayey sand by Z1 and Z2, respectively, we have (cf. Gálfi et al. 1961, p. 233) Z1≈15⋅104grcm−2sec−1;Z2≈40⋅104grcm−2sec−1, and
R=Z1+Z2Z1−Z2=−0,45

Fig. 13 Dependence of the reflection coefficient on the angle of incidence
13. ábra. Reflexiós együttható a beesési szög függvényében
Puc. 13. Зависимость коэффициента отражения от углов падения
As shown in Fig. 14, the spectrum of the composite waveform possesses two isolated peaks indicating that primary and ghost pulses have different spectra. Individual primary and ghost spectra were also determined. The main difference between them is the energy decrease of ghost spectrum, due to spherical and reflection losses and its shift toward lower frequencies, caused by absorption. We have experimental data as yet not enough to elucidate the (presumably frequencydependent) mechanism of ghost production.
In areas under exploration, measurements of this kind may yield valuable informations for digital processing, since the exact knowledge of ghost/primary amplitude ratio and the time-delay involved is a prerequisite for ghost suppression.

Fig. 14 Amplitude spectra of primary and ghost pulses 1 primary, 2 ghost, 3 combined spectrum
14. ábra. Ghostos felvétel amplitudó-spektruma 1 - jel spektruma, 2 - ghost spektruma, 3 - jel és gost egyiittes spektruma
Puc. 14. Амплитудный спектр записей с отражениями-спутниками 1 - спектр истнала 2 - спектр отражения-спутника; 3 - совместный спектр сигнала и отражения-спутника
Attewell, P. B.-Ramana, Y. V., 1966: Wave attenuation and internal friction as functions of frequency in rocks. Geophysics, XXXI. 6., pp. 1049-1056.
Barnhard, P., 1967: Signal strength of marine explosives. Geophysics, XXXII. 5., pp. 827−832.
Blake, F. G., 1952: Spherical wave propagation in solid media. J. Acoust. Soc. Am. XXIV. 2., pp. 211-215.
Born, W. T., 1941: The attenuation constant of earth materials. Geophysics, VI. 1., pp. 132-148.
Duvall, W. I., 1953: Strain-wave shapes in rock near explosions. Geophysics, XVIII., 2., pp. 310−324.
Fogelson, D. E.-Atchison, T. C.-Duvall, W. I., 1959: Propagation of peak strain and strain energy for explosion-generated strain pulses in rock. Colorado School of Mines Quarterly, LIV. 3., pp. 271-284.
Gálfi, J.-Márton, P.-Meskó, A.-Stegena, L., 1967: Geofizikai Kutatási Módszerek I. Szeizmika. (Methods of Geophysical Exploration I. Seismic methods). Tankönyvkiadó, Budapest.
Gaskell, T. F., 1956: The relation between size of charge and amplitude of refracted wave. Geophysical Prospecting, IV. 2., pp. 185-194.
Grinda, L., 1959: Influence de la profondeur de l’amplitude des ondes sismiques engendrées par une explosion sous-marine. Bolletino di Geofisica, I. 2., pp. 161-174.
Habberjam, G. M.-Whetton, J. T., 1952: On the relationship between seismic amplitude and charge of explosive fired in routine blasting operations. Geophysics, XVII. 1., pp. 116−128.
Howell, B. F. Jr.-Kaukonen, E. K., 1954: Attenuation of seismic wave near an explosion. Bull. Seism. Sec. Am., XLIV., pp. 481-492.
Howell, B. F., Jr.-Budenstein, D., 1955: Energy-distribution in explosion generated seismic pulses. Geophysics, XX. 1., 33-52.
Huang Jen-Hu, 1961: A szeizmikus hullám frekvencia spektrumának kialakulása a gerjesztés, tovaterjedés és észlelés folyamán. Kandidátusi értekezés, Budapest. (Change in the spectral properties of seismic waves during generation, propagation and recording. C. Sc. Thesis, Budapest).
Jolly, R. N., 1953: Deep-hole geophone studies in Garvin County, Oklahoma. Geophysics, XVIII. 3., pp. 662-670.
Карус, Е. В. 1958: Поглошение упругих колебаний в гсрных породах при стационарном возбуждении. Известия АН СССР, Серия геофизическая, 4, 438-448. (Attenuation of elastic vibrations in solid media)
Коган, С. Я. 1961: Об определении коэффициента поглошения сейсмических волн. Известия АН СССР, Серия геофизическая, 12, 1738-1749. (Determination of the absorbtion coefficient of seismic waves)
Lányi J.-Rákóczy I., 1969: Vizben, robbantással keltett nyomáshullámok terjedésének mérése. Geofizikai Közlemények, XVIII. 3., pp. 97-102. (Investigations of pressurewaves generated by explosion in water).
Levin, F. K.-Lynn, R. D., 1958: Deep hole geophone studies. Geophysics, XXIII. 4., pp. 639-664.
Mack, H., 1966: Attenuation of controlled wave seismograph signals observed in cased boreholes. Geophysics, XXX. 1., pp. 243-252.
McDonal, F. J.-Angona, F. A.-Mills, R. L.-Sengbush, R. L.-Van Nostrand, R. G.White, J. E., 1958: Attenuation of shear and compressional waves in Pierre Shale. Geophysics, XXIII. 3., pp. 421-439.
O’Brien, P. N. S., 1957: The relationship between seismic amplitude and weight of charge. Geophysical Prospecting, V. 3., pp. 349.
O’Brien, P. N. S., 1960: Seismic energy from explosions. Geophysical Journal, III. pp. 29-44.
O’Brien, P. N. S., 1969: Some experiments concerning the primary seismic pulse. Geophysical Prospecting, XVII. 4., pp. 511-547.
Peet, W. E., 1960: A shock wave theory for the generation of the seismic signal around a spherical shot hole. Geophysical Prospecting, XVII. 4., pp. 509-533.
Ricker, N., 1953: The form and laws of propagation of seismic wavelets. Geophysics XVIII. 1.
Robinson, E. A.-Treitel, S., 1964: Principles of digital filtering. Geophysics, XXIX. 3., pp. 395−404.
Schenk, V., 1971: The predominant frequency of stress waves in non-elastic zone near an explosive source. Geophys. J. R. Astr. Soc. XXII. 4., pp. 347-352.
Tullos, F. N.-Reid, A. C., 1969: Seismic attenuation of Gulf Coast sediments. Geophysics, XXXIV. 4., pp. 516-528.
A dolgozatban ismertetjük az 1968-69-es évben a Nyírségben végzett robbanáshullám kísérletek eredményeit. A méréseket elsősorban az teszi szükségessé, hogy a digitális szeizmikus feldolgozásban, különösen a dekonvolúciós mûvelet során, elengedhetetlen a jelalak és a jelalak időbeli változásának pontos ismerete. A méréseket homokos összletben végeztük, az észlelést piezoelektromos érzékelövel és Tektronix típusú oszcilloszkóppal hajtottuk végre. A kísérletsorozatban a jelalak változását vizsgáltuk a töltet-szonda-távolság és a töltetsúly függvényében. Megállapítottuk, hogy a jelalak amplitúdója r−1; átlagenergiája r−2,3; szélessége r0,2−0,4; csúcsfrekvenciája r0,3−8,8 törvényszerűség szerint függ a távolságtól, a töltetsúly függvényében a jel amplitúdója a W0,5, energiája W1,1, szélessége W0,13, csúcsfrekvenciája W−0,1 szerint változik. Az eredmények W=1/8−4 kg töltetsúlyokra, és r=5−50 m távolságra vonatkoznak. Az eredményeket külön tárgyaljuk lyukban, illetve felszínen végzett észlelés esetére, mert az empirikus kitevők - a laza réteg szürő hatása miatt - az utóbbi esetben módosulnak. Meghatároztuk az adott közegre jellemző frekvenciafüggő abszorpciós törvényt: felszínközeli összletben a teljes csillapodás 2,3⋅10−5,7f2 dB/m. Az elsődleges jelet több esetben ghost beérkezés követte (11. ábra). A ghost követési távolságának és amplitúdójának elemzésével bebizonyítottuk, hogy a ghost a talajvízszint határán képződik. Az elsődleges jel és a ghost frekvenciatartalmának eltérése az abszorpció jelenségére utal. A kísérleti eredmények összhangban vannak az irodalmi adatokkal, az esetleges eltéréseket elemezzük.
A dolgozathoz négy táblázat csatlakozik, az első táblázat a mérés körülményeit foglalja össze, a I., III., IV. Táblázatokban összefoglaljuk az amplitúdótávolság függésére, a frekvenciafüggő abszorpcióra és az amplitúdó töltetsúly függésére vonatkozó irodalmi adatokat.
В работе описываются результаты опытных работ, проведенных в 1968-1969 гг. в районе Ниршег (Северо-восточная Венгрия) для анализа продольных волн, возбужденных взрывами. Постановка подобного рода исследований была обусловлена тем, что при цифровой обработке сейсмических данных, в частности, при операциях деконволюции, необходимо точно знать формы сигналов и их изменения во времени. Наблюдения проводились в песчаной толще с использованием пьезоэлектрического приемника и осциллоскопа типа Тектроникс. В процессе исследований анализировались изменения формы сигналов в зависимости от расстояния до пункта возбуждения и от величины зарядов. Обнаружено, что для амплитуды сигнала характерна закономерность изменения с расстоянием r−1, для средней его интенсивности −r−2,3, для ширины −r0,2−0,4 и для предельной частоты −r0,3−0,8, а закономерность изменения с величиной заряда выражается для амплитуды - W0,5, для интенсивности −W1,1, для ширины −W0,13 и для предельной частоты −W−0,1. Результаты действительны для величин заряда W=1/8−4 кг и для расстояний r=5−50 m. Раздельно рассматриваются результаты наблюдений, проведенных на дневной поверхности и в скважинах, поскольку эмпирические показатели неодинаковы в связи с фильтрующим эффектом зоны выветривания. Был определен закон изменения поглощения в зависимости от частоты, характерный для данной среды: затухание волн в приповерхностной толше равно 2,3⋅10−5,3f2 дб/м. За первычным сигналом во многих случаях следовали отражения-спутники (см. рис. 11). Анализ протяженности и амплитуды отражения-спутника позволил сделать вывод о том, что последнее образуется на границе грунтовых вод. Отклонение частотных характеристик первого сигнала и отражения-спутника свидетельствует о наличии поглощения. Полученные результаты согласуются с литературными данными, а причины возможных отклонений анализируются.
К работе прилагаются 4 таблицы, в первой из которых приведены данные об условиях наблюдений, а во второй, третьей и четвертой таблицах представлены литературные данные о завэсимостях амплитуды от расстояния, поглошения от частоты и амплитуды от величины заряда, соответственно.
.
During the second year of the project additional observations were collected to study empirical features of seismic energy generation for different explosion seismic sources, and how this energy is partitioned between P, S, and surface waves, in specific geological conditions and tectonic settings of the Middle East. The observations concern buried experimental explosions and surface military detonations, for which Ground Truth information (GT0) and blast design parameters were collected. We analyzed source features and scaling for single-fired, surface explosions at Sayarim military range near Eilat, observed at near-source 3C portable short period (SP) seismometers and regional International Monitoring System (IMS) broadband (BB) stations. A dataset of combined observations of seismic and infrasound waves at collocated sensors was also collected, with S-wave manifestation at distances of up to 150 km. Ground-truth data for 19 explosions in a broad charge weight range (100-8500 kg), recorded at numerous portable and permanent SP and BB stations, facilitated the analysis of energetic characteristics of seismic signals depending on the yield. Source scaling parameters were determined for regional phases observed at BB station EIL (33-38 km). Obtained estimations and waveform features for the surface seismic sources were compared to nearby Sayarim buried (borehole) experimental explosions conducted by the Geophysical Institute of Israel (GII) in 2004, recorded also at EIL. After correction the data for the distance and type of explosives, the scaling power law parameter for P-waves (0.91) with maximal amplitudes was found similar to that for the buried explosions (0.93). The new jSTAR software developed at GII was applied to collected seismograms for the energy generation analysis. Analysis of Bet-Alpha buried explosions, conducted by GII in 2005 at a basalt quarry and recorded at BB MMLI station, confirmed that amplitudes of regional phases and local magnitudes are well correlated with the scaled depth. Coda-derived moment-rate spectra techniques were applied to BB records for determination of stable regional magnitude for some large-scale calibration explosions conducted by GII: A series of three depth of burial (DOB) experimental explosions of near-spherical charges (five tons of Ammonium Nitrate Fuel Oil [ANFO]) at different depths (22, 43, and 63 m) at Rotem phosphate quarry is scheduled for July 2006. During preparations of the experiment, a number of test shots were conducted in marl rocks to elaborate optimal blast design parameters. Large cavities (up to 3 m) were created at significant depths (up to 63 m) using a special technique, and a number of fully coupled and partially decoupled test explosions were conducted and recorded by numerous portable seismic sensors and permanent stations.
1974
Peak ground velocities as a function of distance for 45 the GREELEY nuclear blast at the Nevada 'Pest Site, 2'0 Dec. 1966. Tlic motion was recorded for the horizontal component of the Lg phase Peak ground 'velocities as a function of distance for 46 the DUMONT nuclear blast at the Nevada Test Site,
During the third year of the project, two source phenomenology experiments were conducted at Oron phosphate quarry in Northern Negev. A special complicated technology was used for the creation of large cavities (up to 3.5 m) at different depths (up to 63 m), and accommodation of large near-spherical charges of ANFO explosives. A series of decoupled and fully coupled (reference) explosions with charges of 1240 kg in the cavities was conducted on July 17, 2006. Extensive observations in near-source zone and remote area demonstrated peculiar signal characteristics and energy generation features related to these specific decoupled seismic sources. S/P energy ratios and decoupling factors were estimated at local distances, matching roughly to theoretical conceptions. The project central Depth-of-Burial (DOB) experimental series was conducted on January 2, 2007, and included three equal near-spherical charges of 4,200 kg at depths 26 m, 45 m and 59 m. The main objective of the experiment was to investigate relations between explosion depth and spectral/energetic/magnitude parameters of regional seismic phases. The design and configuration of the Oron DOB experiment were preferable in purity of conditions compared to the previous Balapan DOB experiment (1997): media homogeneity (all charges were placed in similar consolidated sediments), full containment and small separation (~200 m) of the explosions, charge scaled depths in the range of Nevada Test Site (NTS) nuclear tests. An important goal of our experiment was to get rid of the asymmetry effect caused by the difference of lithostatic pressures above and below the vertical lengthy cylinder explosive source, typical for borehole chemical explosions, and to study the generation of shear waves for about spherically symmetric sources, typical for nuclear tests. Numerous good recordings of signals from all shots were obtained at portable near-source accelerometers and close-in 3C seismic stations, permanent local short period (SP) and broad band (BB) stations, and International Monitoring System (IMS) stations EIL and MMAI in Israel, and ASF in Jordan. An important effect observed for near-source accelerometer records was a clear trend of the signal peak amplitude and energy enhancement with the charge depth increase. This effect was accompanied by a significant signal frequency raise, providing empirical verification and estimation of decreasing seismic source size due to increase of overburden lithostatic pressure. Evidently, high frequencies of the radiated signal resulted in rapid attenuation of seismic energy with distance, a drastic drop of amplitude for deeper shots is clearly manifested already at distance of several km, and consequently a clear expected tendency of signal energy and magnitude reduction with depth is observed at regional distances. Analysis of seismic waveforms (in the broad band 1-20 Hz) at close local and regional distances (3.5-240 km) demonstrated a clear decrease of peak amplitude and energy for S-phase and corresponding S/P ratios for deeper shots. The frequency dependence of spectral amplitudes on shot depth was observed at most stations for the both phases: a decrease of amplitudes with increasing shot depth between about 1 and 10 Hz is converted to the opposite trend at higher frequencies ~10-20 Hz.
Bulletin of the Seismological Society of America, 2009
Two source phenomenology explosion experiments-decoupling and depth-of-burial (DOB)-were conducted by the Geophysical Institute of Israel (GII) in July 2006 and January 2007 in Negev, Israel. A special blast design and technology were utilized to form large 1240 kg (decoupling) and 4200 kg (DOB) nearspherical Ammonium Nitrate and fuel oil charges in cavities at different depths (26-63 m), in marls and phosphates, created beforehand by small shots in boreholes. The main goal of the experiments was investigation of empirical relationships between the contained spherical source and energy/magnitude parameters of different seismic phases at near-source and regional distances. Small decoupling factors for the heavily overdriven tests were estimated as 2.8 and 6.4 for charge/volume ratios 250 and 70 (kg=m 3), respectively. Very high signal frequencies (40-90 Hz) accompanied by the highest peak accelerations were observed at near-source distances for the deep (63 m) decoupled explosion. A clear magnitude/ energy reduction with increasing depth of contained sources was obtained at regional distances (similar to the 1997 Balapan DOB experiment), complemented by nearsource recordings of higher frequencies and larger amplitude/energy for deeper charges. Observations of the Negev DOB experiment are remarkably consistent with the Mueller and Murphy (1971) model predictions of source spectra features. The same conversion point of spectra dominance at f c ∼ 10 Hz for different depth shots, predicted by the model, was observed over a broad distance range (0.2-230 km). The novel aspects of the experiments include (1) investigating seismic coupling in a source medium (soft sediments) that was not previously studied to a large extent, (2) using a homogeneous source medium for all the tests, (3) using nearly spherical explosive sources as opposed to the long cylindrical charges used in most previous large-scale high explosives tests, and (4) full containment of all explosions. The experiments, designed to simulate nuclear sources, provide data and knowledge for improvement of nuclear test monitoring for low-yield explosions.
Pure and Applied Geophysics, 2001
In studying the physical processes involved in the generation of seismic waves by explosions, it is important to understand what happens in the region of high stresses immediately surrounding the explosion. This paper examines one of the processes that takes place in this region, the growth of pre-existing cracks, which is described quantitatively as an increase in rock damage. An equivalent elastic method is used to approximate the stress ®eld surrounding the explosion and a micromechanical model of damage is used to calculate the increase in damage. Simulations for a 1 kt explosion reveal that the region of increased damage can be quite large, up to ten times the cavity radius. The damage is initiated on a damage front that propagates outward behind the explosive stress wave with a velocity intermediate between that of P and S waves. Calculations suggest that the amount of increased damage is controlled primarily by the initial damage and the extent of the region of increased damage is controlled primarily by the initial crack radius. The motions that occur on individual cracks when damage increases are converted to seismic moment tensors which are then used to calculate secondary elastic waves which radiate into the far ®eld. It is found that, while the contribution from an individual crack is small, the combined eect of many cracks in a large region of increased damage can generate secondary waves that are comparable in amplitude to the primary waves generated by the explosion. Provided that there is asymmetry in the damage pattern, this process is quite eective in generating S waves, thus providing a quantitative explanation of how S waves can be generated by an explosion. Two types of asymmetry are investigated, a shear pre-stress and a preferred orientation of cracks, and it is found that both produce similar eects.
Sadhana, 2014
Seismic signals due to any underground nuclear explosion events are known to be influenced by the local geology of the test site and the yield level. In this paper, transient three-dimensional finite element code SHOCK-3D developed for the simulation of underground nuclear explosion events has been used to obtain synthetic acceleration signals for Baneberry site (Nevada) single and composite rock media. At this site an underground nuclear test of 10 kT conducted on 18th December 1970 at source depth of 278 m resulted into venting as reported by Terhune et al with 2D simulation results and later by us through 3D simulation in Ranjan et al. First, the reasons of the venting for this event are summarized. After the successful validation of the 3D numerical model for Baneberry site rock media, parametric studies are carried out for 1 and 8 kT yields at 100 m depth (Scaled Depths of Burst SDOB ∼ 100 and 50 m/kT 1/3 , respectively) for homogeneous and composite Paleozoic and Tuff media of Baneberry site. It is demonstrated that the near source local geological formations and associated nonlinear effects significantly influence the seismic signals. With this study the seismic decoupling of the source by an order of magnitude has been illustrated. Finally, it is concluded that the seismic signals alone, in the absence of in-depth information of the local geology of the specific test site, are not appropriate measures of the source strength.
1990
OBJECTIVE The primary objective of this study is to develop an algorithm that will routinely discriminate between ripple-fired mine explosions (events that consist of several sub-explosions closely grouped in space and time) and all other seismic events (including earthquakes and single-event explosions).
Natural Science, 2012
During earthquakes and strong underground explosions it is possible to observe two different effects. The first one is connected with the destruction of media, and this causes acoustic and later hybrid acoustic-electromagnetic waves in an epicenter in the atmosphere and in the ionosphere. Another one is connected with cracks in crystals of rocks, which seems more interesting, because it is possible to recognize the natural earthquakes and industrial explosions. In the first effects due to nonlinear elastic modules the acoustic waves move through the lithosphere and transform their spectra from VLF (very low frequencies ~ 1-10 kHz) at a depth of about 30 km into the lower part of ELF (extremely low frequencies ~ 3 Hz-1 kHz) on the Earth's surface, then they pass the atmosphere and penetrate into the ionosphere. During the nonlinear acoustic passage through the atmosphere and the ionosphere, the spectrum transforms from ELF into ULF (ultra low frequencies < 1 Hz) range. In this review article the classification of spectrum and analysis of two cases of the destruction of rocks in the lithosphere are presented. The rocks possess piezoelectric and piezomagnetic properties. In this case, the electromagnetic emission is excited by the fracturing in plates of crystals. The difference of emission from piezoelectric and magnetic plates in cases of industrial explosions and natural seismic events including volcanic phenomena gives a possibility to analyze the method of its identification. The consideration is based on the model of the plate of a finite size with a uniformly moving crack.
Journal of Applied Geophysics, 2012
Peak particle acceleration and velocity Frequency spectra Linear explosive charges Direct and reverse initiation of explosive A study of the effect of explosive source orientation in a borehole on the nature of emanating seismic waves was made. High frequency triaxial accelerometers mounted on the surface and in boreholes in underground mines were the diagnostic sensors. A variety of explosive sources initiated with the detonation reaction propagating towards the detector and away from the detector were studied in highly competent rock. The results show significant differences in both the amplitude and the frequency spectra of the signal for the two modes. The respective azimuthal distribution of P and S wave amplitudes from propagating linear sources are also found to be at variance with those predicted by existing theoretical approaches.