. 2007 Jan;117(1):143-52.
doi: 10.1172/JCI25483. Epub 2006 Dec 21.

Extrapancreatic incretin receptors modulate glucose homeostasis, body weight, and energy expenditure

Affiliations

Extrapancreatic incretin receptors modulate glucose homeostasis, body weight, and energy expenditure

Tanya Hansotia et al. J Clin Invest. 2007 Jan.

Abstract

The incretin hormones glucagon-like peptide-1 (GLP-1) and glucose-dependent insulinotropic polypeptide (GIP) control glucose homeostasis through well-defined actions on the islet beta cell via stimulation of insulin secretion and preservation and expansion of beta cell mass. We examined the importance of endogenous incretin receptors for control of glucose homeostasis through analysis of Glp1r(-/-), Gipr(-/-), and double incretin receptor knockout (DIRKO) mice fed a high-fat (HF) diet. DIRKO mice failed to upregulate levels of plasma insulin, pancreatic insulin mRNA transcripts, and insulin content following several months of HF feeding. Both single incretin receptor knockout and DIRKO mice exhibited resistance to diet-induced obesity, preservation of insulin sensitivity, and increased energy expenditure associated with increased locomotor activity. Moreover, plasma levels of plasminogen activator inhibitor-1 and resistin failed to increase significantly in DIRKO mice after HF feeding, and the GIP receptor agonist [D-Ala(2)]GIP, but not the GLP-1 receptor agonist exendin-4, increased the levels of plasma resistin in studies of both acute and chronic administration. These findings extend our understanding of how endogenous incretin circuits regulate glucose homeostasis independent of the beta cell via control of adipokine secretion and energy expenditure.


Figures

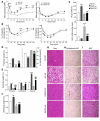
Figure 1
Figure 1. DIRKO mice exhibit reduced weight gain and impaired glucose tolerance on HF diet.
(A) Body weight gain in WT and DIRKO mice on RC or HF diet (n = 8–13 per group). (B and C) Oral glucose tolerance in WT (B) and DIRKO mice (C) fed RC or HF diet for 12 weeks (n = 6–8 per group). At right, plasma insulin concentrations obtained 10 minutes after glucose administration (top; n = 6–8 per group) and quantification of AUC for the total glycemic excursions (bottom; n = 6–8 per group). (D) Plasma insulin/glucose ratios (ng/ml to mmol/l) at the 10–20 minute time point following glucose administration (n = 6–8 per group). *P < 0.05, ***P < 0.001 versus WT-RC; ###P < 0.001 versus WT-HF; ΧΧP < 0.01 versus DIRKO-RC.
Figure 2
Figure 2. Analyses of the endocrine pancreas in WT and DIRKO mice.
Following 20 weeks on RC or HF diet, nonfasted WT and DIRKO mice were euthanized, and pancreata were harvested for assessment of insulin mRNA and insulin content as well as for histological and morphometric analyses. Blood was also obtained by cardiac puncture for measurement of ambient levels of circulating insulin. (A) Pancreatic histology and immunohistochemical staining for insulin in sections from WT and DIRKO mice. Original magnification, ×100. (B) Percent total β cell area per total pancreatic area (n = 5–9 per group). (C) Total islet number per total pancreatic area in μm2 (n = 6–9 per group). (D) Number of BrdU+ β cells per islet (n = 4–7 per group). (E) Insulin mRNA levels in pancreata from mice (n = 7–8 per group). (F) Pancreatic insulin content in WT and DIRKO mice (n = 7–10 per group). (G) Ambient levels of plasma insulin (n = 8–12 per group). *P < 0.05, **P < 0.01, ***P < 0.001 versus WT-RC; #P < 0.05, ###P < 0.001 versus WT-HF; ΧP < 0.05 versus DIRKO-RC.
Figure 3
Figure 3. DIRKO mice are protected from HF diet–induced insulin resistance.
(A) Glucose levels during an insulin tolerance test in RC- and HF diet–fed WT and DIRKO mice (n = 8–9 per group). After 19 weeks of HFF, WT and DIRKO mice were fasted for 5 hours and subsequently injected with 1.2 U/kg insulin. Blood glucose levels were monitored for 4 hours following insulin administration. (B) Glucose levels during an insulin tolerance test expressed as percentage of baseline blood glucose values in WT and DIRKO mice. (C) Quantification of AUC for the total glycemic excursions in A and AUC normalized to fat mass. (D) Weights of total body fat and lean mass normalized to body weight (n = 8–9 per group) in WT and DIRKO mice fed RC or HF diet for 19 weeks as assessed by MRI. (E) Weights of perirenal, epididymal, and inguinal fat pads normalized to body weight (n = 8–12 per group). (F) Weight of brown adipose tissue (BAT) normalized to body weight (n = 8–12 per group). (GI) Histological analyses of (G) liver, (H) epididymal white adipose tissue (WAT), and (I) brown adipose tissue from WT and DIRKO mice fed RC or HF diet. Sections were stained with H&E. Original magnification, ×200. *P < 0.05, **P < 0.01, ***P < 0.001 versus WT-RC; ###P < 0.001 versus WT-HF; ΧΧP < 0.01, ΧΧΧP < 0.001 versus DIRKO-RC.
Figure 4
Figure 4. Increased energy expenditure in DIRKO mice.
(A) Following an overnight fast (16–18 hours), WT and DIRKO mice were placed in individual cages, and food intake was monitored over 24 hours (n = 7–8 per group). Data are expressed as kcal consumed per day, kcal consumed per gram of body weight per day, and kcal consumed per gram of fat mass per day. (B) Oxygen consumption (VO2) was measured during the light and dark cycles in WT and DIRKO mice (n = 8 per group). (C) Total oxygen consumption over the light and dark phases, resting oxygen consumption (oxygen consumption over the light phase), and total and resting oxygen consumption normalized to fat mass. (D) Assessment of physical activity (as described in Methods) during the light and dark cycles in WT and DIRKO mice (n = 4–6 per group). At right, data are expressed as total physical activity over the light and dark cycles. (E) Expression of β3AR mRNA levels in epididymal white adipose tissue (n = 5–7 per group) relative to 18S. (F) Expression of UCP-1 in brown adipose tissue (n = 5–6 per group) relative to 18S. *P < 0.05, **P < 0.01, ***P < 0.001 versus WT-RC; #P < 0.05, ##P < 0.01, ###P < 0.001 versus WT-HF; ΧP < 0.05, ΧΧP < 0.01, ΧΧΧP < 0.001 versus DIRKO-RC.
Figure 5
Figure 5. Ambient circulating levels of plasma adipokines in mice fed RC or HF diet for 20 weeks.
Following 20 weeks on RC or HF diet, WT and DIRKO mice were euthanized and cardiac blood was obtained. (A) Ambient levels of circulating leptin in WT and DIRKO mice (n = 7–11 per group). At right, data are expressed as a scatter plot with leptin levels on the y axis and fat mass on the x axis, demonstrating that the leptin levels were at the level expected for the degree of adiposity. (BD) Ambient levels of circulating (B) adiponectin (n = 8–12 per group), (C) resistin (n = 8–12 per group), and (D) PAI-1 (n = 7–12 per group) in WT and DIRKO mice following 20 weeks of RC or HF diet. **P < 0.01, ***P < 0.001 versus WT-RC; ###P < 0.001 versus WT-HF.
Figure 6
Figure 6. Resistin secretion stimulated by [D-Ala2]GIP in WT and Gipr–/– mice.
(AC) Effect of 24 nmol/kg [D-Ala2]GIP or Ex-4 on resistin secretion in 10-week-old (A) WT, (B) Glp1r–/–, and (C) Gipr–/– mice following an oral glucose load (n = 5–15 per group). Mice were fasted overnight, after which PBS or peptide was administered immediately prior to oral glucose loading. Mice were euthanized at 45 minutes following peptide/glucose administration, and cardiac blood was obtained. *P < 0.05, ***P < 0.001 versus PBS and Ex-4.
Figure 7
Figure 7. Chronic exposure of WT mice to incretin receptor agonists.
WT mice were maintained on HF diet starting from 6 weeks of age. After 4 weeks of HFF, mice were administered either PBS or 24 nmol/kg [D-Ala2]GIP or Ex-4 twice daily for 2 weeks, after which body fat composition was assessed by MRI. Mice were euthanized 1 hour after the last injection of PBS or peptide, and cardiac blood was collected. (A) Total body fat mass normalized to body weight (n = 8–19 per group). (B and C) Ambient levels of (B) plasma leptin and (C) plasma resistin in HF diet–fed WT mice treated twice daily with either [D-Ala2]GIP or Ex-4 (n = 8–19 per group). **P < 0.01 versus PBS; ΧP < 0.05, ΧΧΧP < 0.001 versus [D-Ala2]GIP; #P < 0.05 versus Ex-4.

References

    1. Badman M.K., Flier J.S. The gut and energy balance: visceral allies in the obesity wars. Science. 2005;307:1909–1914. - PubMed
    1. Perley M.J., Kipnis D.M. Plasma insulin responses to oral and intravenous glucose: studies in normal and diabetic subjects. J. Clin. Invest. 1967;46:1954–1962. - PMC - PubMed
    1. Creutzfeldt W. The incretin concept today. Diabetologia. 1979;16:75–85. - PubMed
    1. Mayo K.E., et al. International Union of Pharmacology. XXXV. The glucagon receptor family. Pharmacol. Rev. 2003;55:167–194. - PubMed
    1. Drucker D.J. Glucagon-like peptides: regulators of cell proliferation, differentiation, and apoptosis. Mol. Endocrinol. 2003;17:161–171. - PubMed

Publication types